Page History
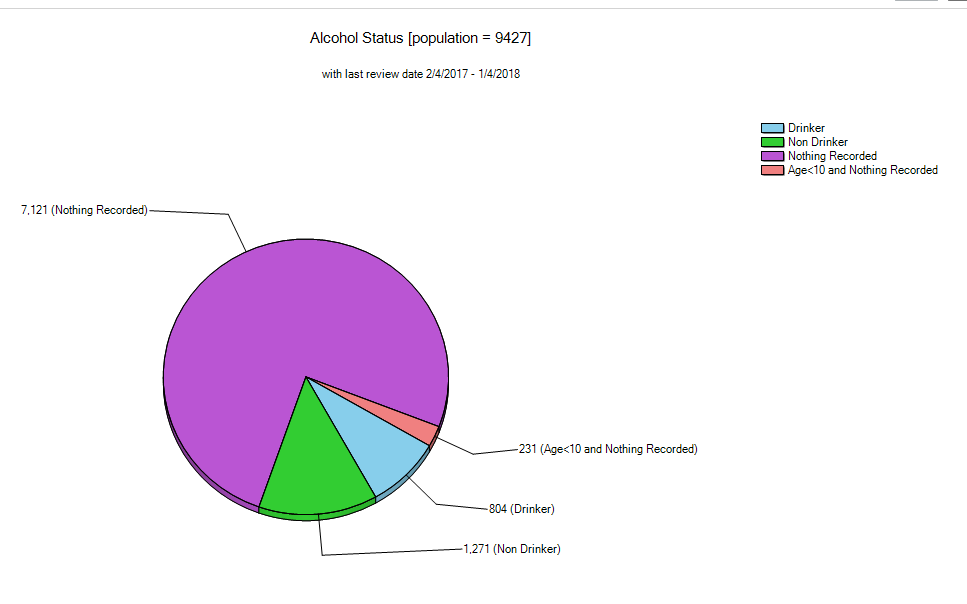
Alcohol displays your data as a breakdown of alcohol status: Drinker, Non Drinker, Nothing Recorded. The data is displayed as a pie chart.
Functions available are as described for Allergies at the beginning of this chapter.
Alcohol level of risk is currently under discussion and will be added soon. This report can be filtered by date of the smoking assessment using the 'Date Range Result' filter.