Page History
Remember: Click the 'Hide Extracts' and 'Hide Filter' buttons to maximise the use of your screen for viewing results.
The tabs along the top of the reports panel allow you to view various graphical representations of your data set.
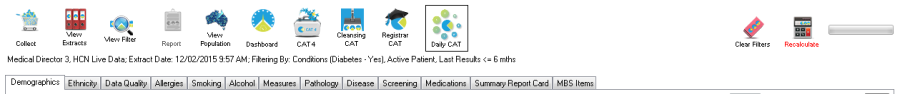
Figure 40: Report Tabs
With the introduction of CAT4 and the dashboard there are now different ways of customising the way CAT4 displays the reports. In the list below all available reports are detailed, but depending on the view you are using there will be less reports visible. To view all reports in the same order as below you will have to load the CAT4 view which shows every report tab.
These are
...