Page History
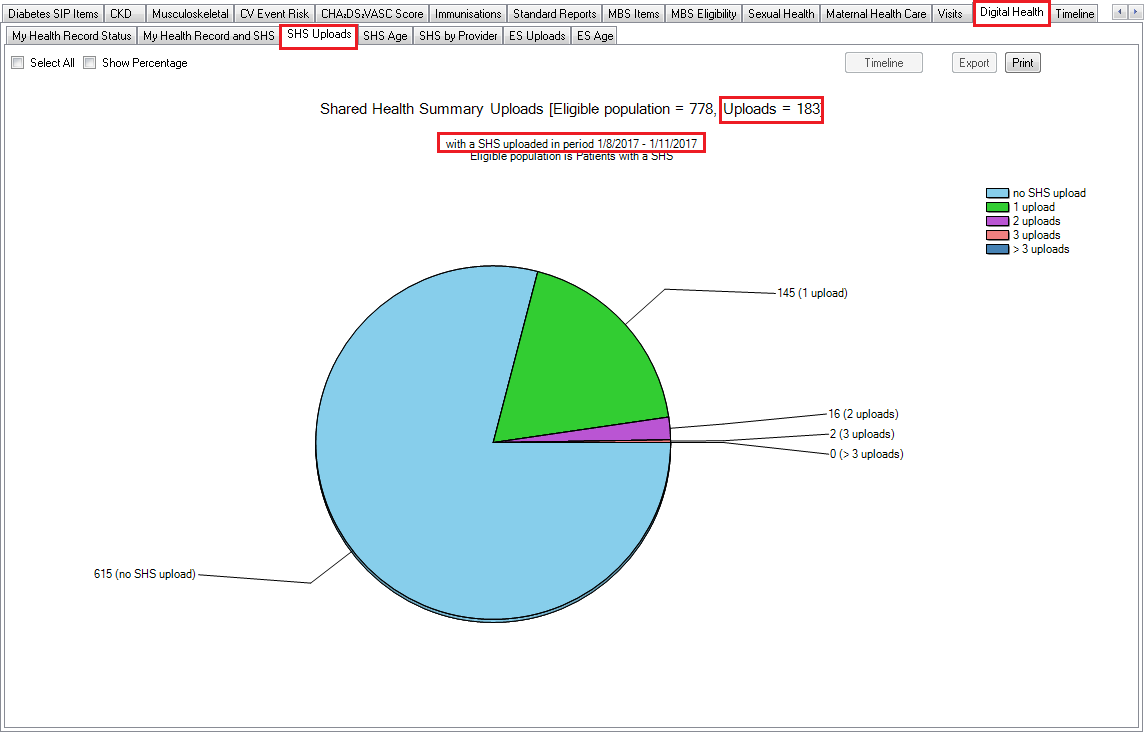
This graph will show patients that have a SHS (the number will match that on the My Health Record and SHS graph) and, of that group, the number of times the SHS has been uploaded.
In most cases the Date Range (Results) filter should be used to find SHS's that have been last uploaded in a timeframe and will display the number of times in that timeframe.
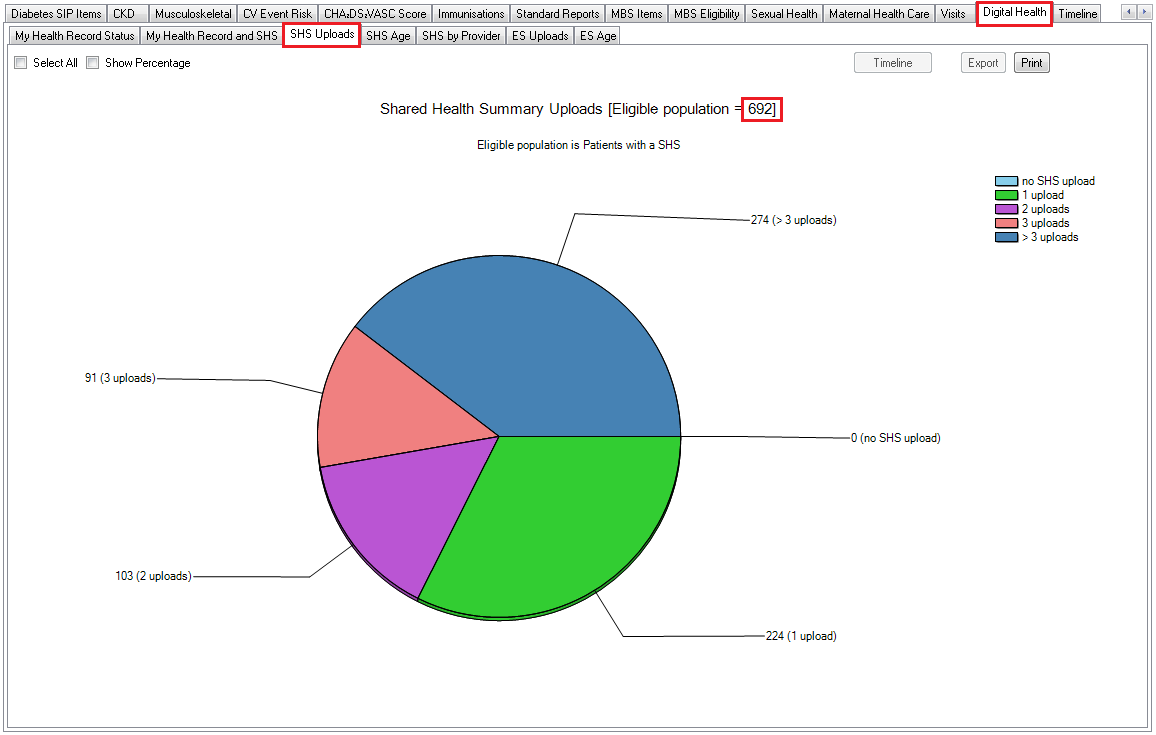
Patients will only appear in the 'no SHS upload' category if their last upload date is outside the date range selected. If there is no date range filter applied this category will be empty.
...
The title of the graph includes the eligible population (anyone with a SHS and the total number of uploads in the selected time period.