Page History
...
- Data Extracts collected for analysis (Left Hand Panel)
- Data Filters (Top Right Panel)
- Data Reports (Bottom Right Panel)
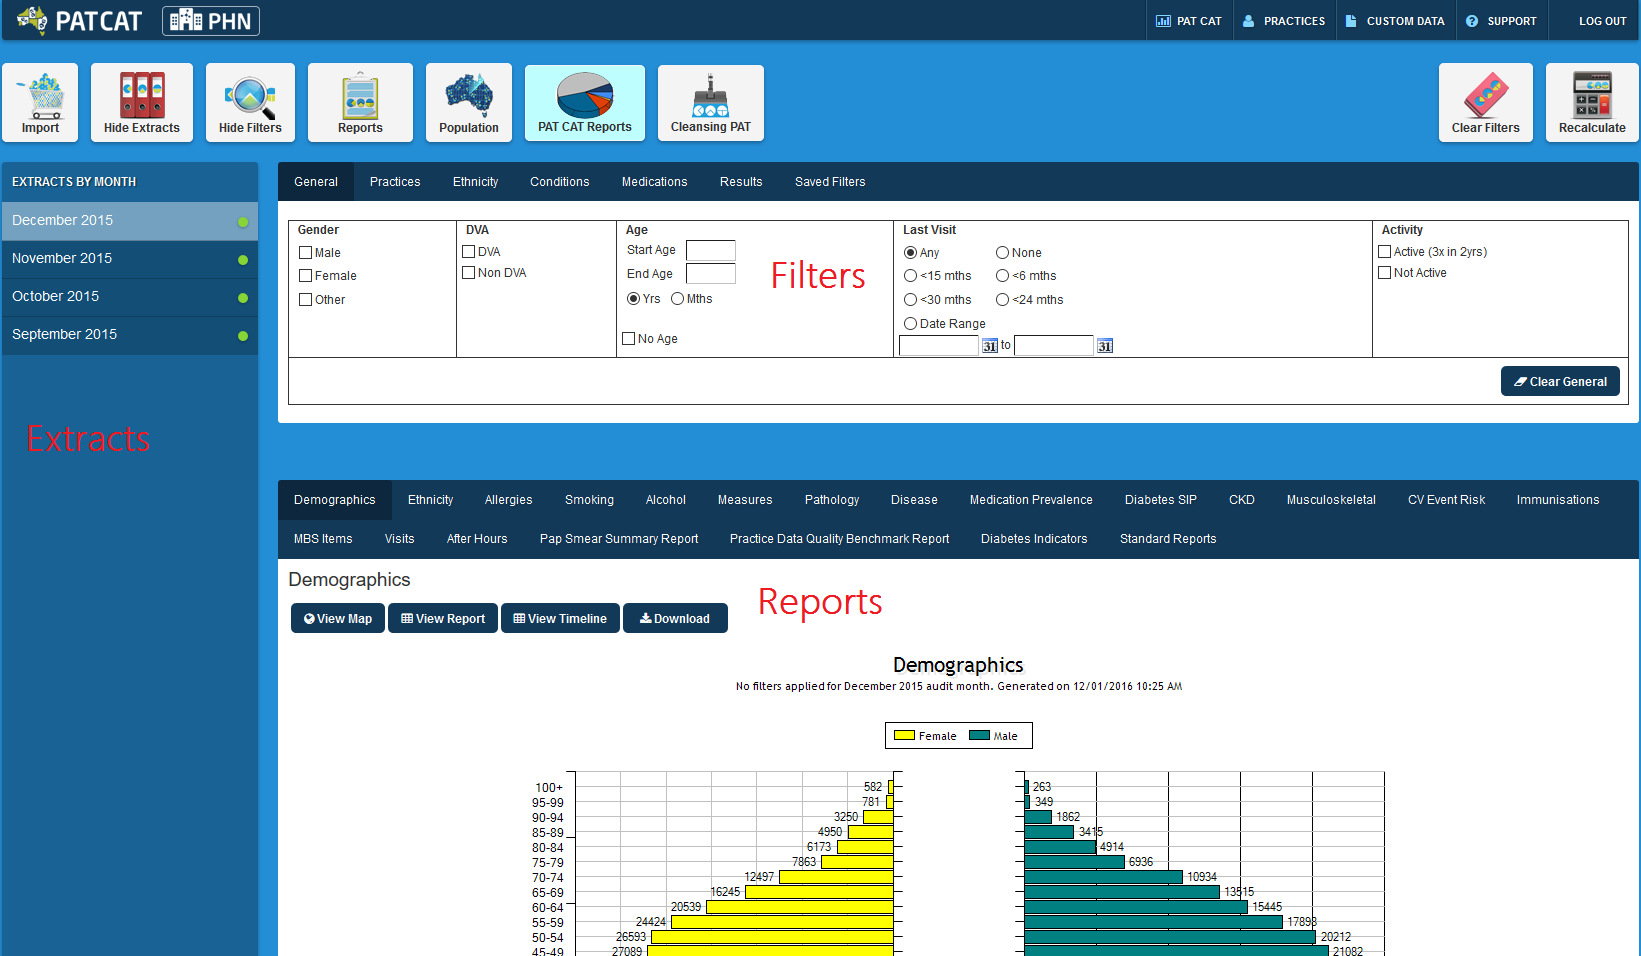
ReportsFiltersExtracts
...
Figure 19: PAT CAT User Interface Elements
When a month is listed under EXTRACTS BY MONTH in the Extracts panel, it means that extracts have been loaded during that month from at least one practice registered within the system. Where the listed month is followed by a green dot, it means that all registered practices have an extract loaded for the month; a red dot means that only some of the registered practices have an extract loaded for the month.
NOTE: Individual practice extracts are not listed in the extracts pane, however data from a single practice may be analysed by selecting a month in the Extract pane and filtering by a specific practice. See section 7.5 for more details.
Click the View/Hide Extracts and the View/Hide Filters buttons to toggle between displaying and hiding the associated panels in user interface.
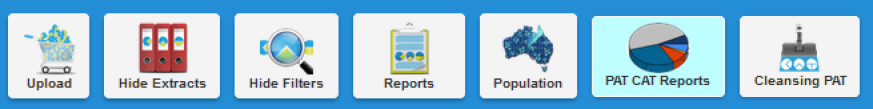
Figure 20: View/Hide Extracts and Filters
It is often handy to hide the data collection (Extracts) and data filter (Filters) areas of the screen in order to make best use of your screen space to view the data results (Reports). You can toggle between the View/Hide modes at any time.