Page History
...
Functions available are as described for Demographics (Bar Chart).
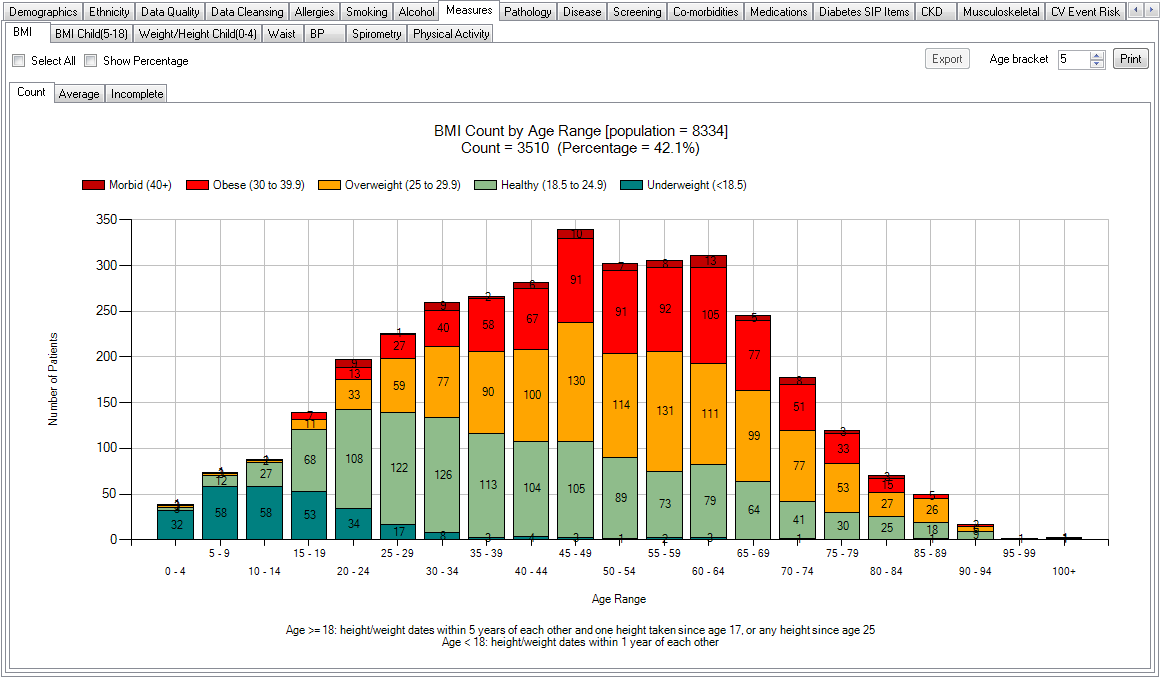
The 'Count' on the Count graph will show you the total of the patients graphed – this is the total number of patients where BMI has been able to be calculated . The Percentage equivalent of Count is displayed in brackets. 
Figure 51: BMI Count of patients where data is complete
BMI Mappings with clinical systems
...
- At least one height recorded since age 25
- Age < 18:
- Height/weight dates are within 1 year of each other