Versions Compared

Key

  • This line was added.
  • This line was removed.
  • Formatting was changed.


Getting Started


Installation

Refer to the PCS Clinical Audit Tool® Quick Reference Guide for installation instructions and an overview of CAT features.


Registrar CAT


Anchor
_GoBack
_GoBack
Overview

Registrar CAT provides supporting information for practice accreditation and reporting as a training post for Registrars. It allows the practice to report and manage Registrar activities.
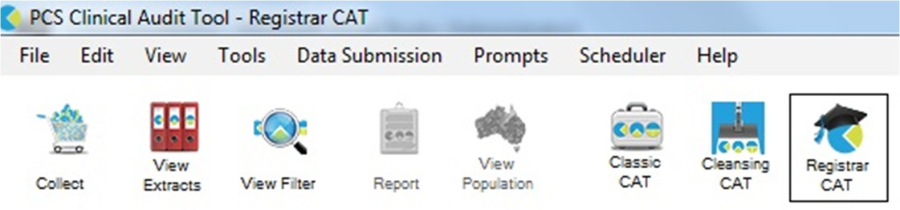
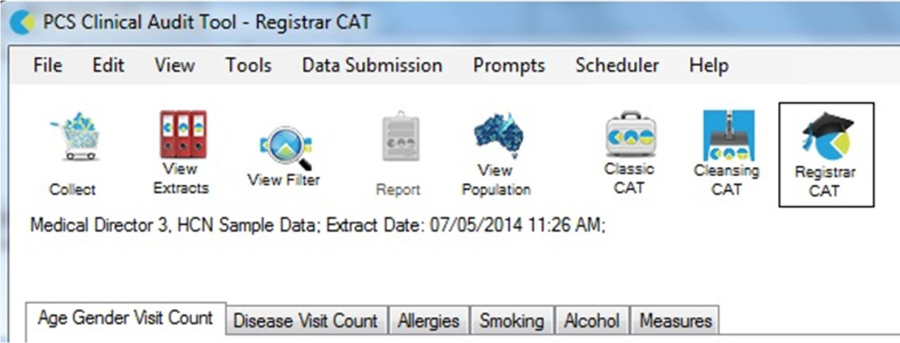
  1. It provides graphical reports on the range of clinical presentations a Registrar has seen in the practice compared to the full set of presentations that are being seen at the practice. This enables the practice to ensure the Registrar is seeing a good coverage of practice presentations.
  2. It provides graphs of clinical information that should be recorded in a patient's record. This can help determine if a Registrar has not carried out activities that should have been reviewed as part of the consultation.


    It is available for MD, BP and Zedmed users.


Accessing the
Registrar CAT
Module

To access the Registrar CAT click the Registrar CAT icon on the menu bar.
Image Added
Alternatively you may select the menu option
View> Registrar CAT

Your usual CAT view is known as Classic CAT and you can click back into this view at any time.


Image Added


Please note: The Registrar CAT Module is a licensed addition to the standard CAT application. If you are not licensed for the module you will get an alert message. Contact Pen Computer Systems for information about how to purchase Registrar CAT.


Registrar CAT Filters


Registrar CAT Filters

Filters specifically designed for Registrar CAT have been added:
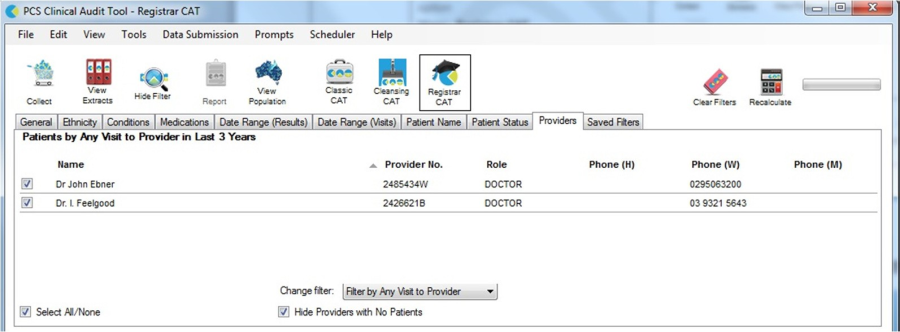
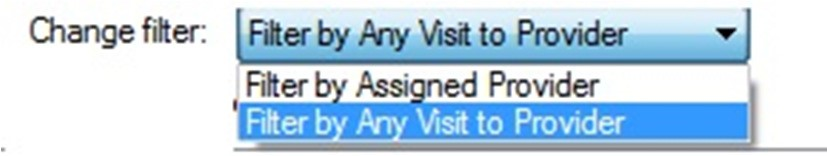
  • Providers – has a new option to switch to filter by 'Visits to Provider' rather than 'Assigned Provider'
  • Date Range (Visits)

Image Added

Filter by Visits to Providers

The Providers filter provides 2 filter options:
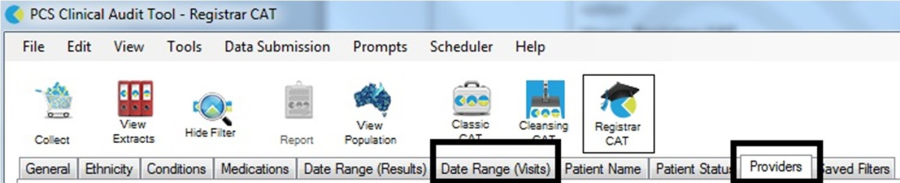
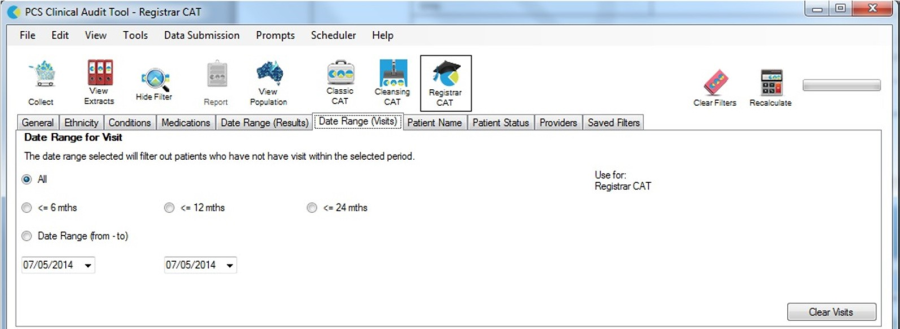
  • Assigned Provider – patients are assigned to one provider based on who they have seen most frequently in recent consultations Patients will be assigned to the provider who saw them for the highest number of consultations in the previous 18 months. Where there is no consultation recorded in the previous 18 months, the patient will be assigned to the provider who saw them most recently, up to 5 years ago. Where there is no consultation recorded in the previous 5 years, no provider will be assigned.
    .
  • Any Visit to Provider – patients are assigned to every provider they have seen in the last 3 years.


    The 'Any Visits to Provider' filter allows the practice to review all patients that a provider has seen in a selected timeframe. The default time frame is the last 3 years.

    NOTE:
    Classic CAT defaults to Assigned Provider. Registrar CAT defaults to Any Visit to Provider.

Image Added

The filter option can be switched at the bottom of the filter panel:
Image Added


Filter by Visits Date Range

The Date Range (Visits) filter allows the patient visits to be filtered for a selected timeframe.

Select the required date range that allows Registrar CAT to report on the Registrar training period.

Image Added

Registrar CAT Graphs


Registrar CAT Graphs

Registrar CAT provides the following graphs:
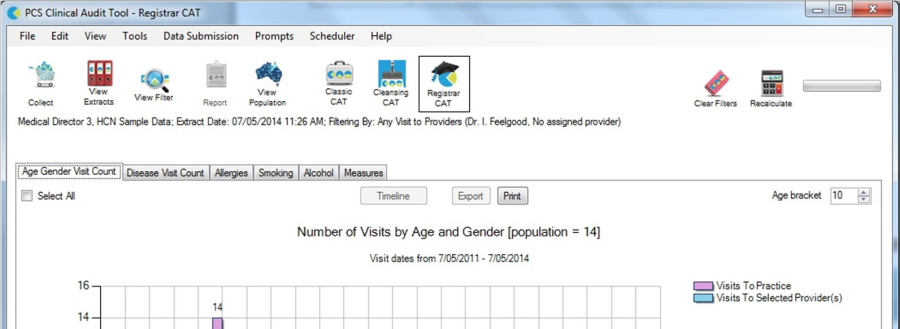
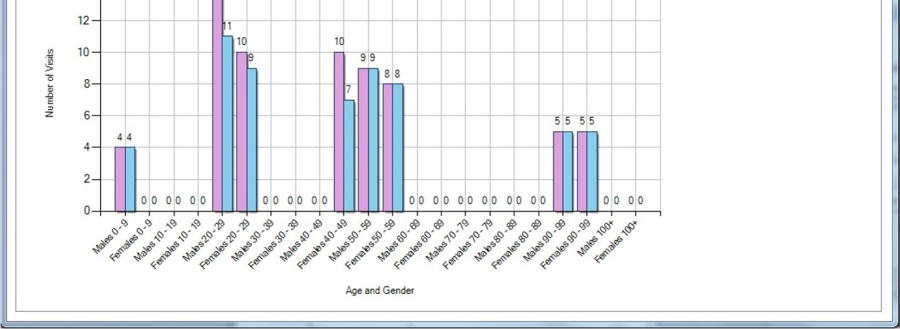
  • Age Gender Visit Count – the number of visits by age range and gender. This graph allows the practice and provider visit profile to be compared.
  • Disease Visit Count – the number of visits by patient disease. This graph allows the practice and provider visit profile to be compared.
  • Clinical graphs for Allergies,
    Smoking, Alcohol, BMI and BP

Image Added


Number of
Visits by Aged and Gender

The Number of Visits by Age and Gender graph provides a breakdown of visits to the practice, in a selected time frame, by age range and gender.
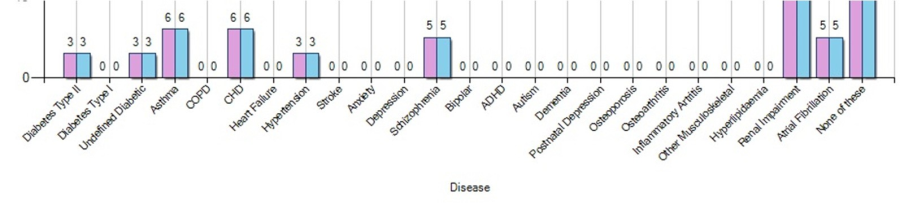
  • Age range defaults to 10 years. This can be adjusted using the Age bracket selection.


  • Visits time frame defaults to that last 3 years. This can be adjusted using the Date Range (Visits) filter described above.


    The graph displays number of visits by:
  • Visits To Practice in purple
  • Visits to Selected Provider(s) in blue


    Image Added

    If no Provider is selected only the practice visits will be displayed.

    To view a providers visits:
  • Filter by Visits to Any Provider and select the Provider you wish to view. Recalculate.
  • The graph will display a comparison of visit counts between the Provider and the Practice.

Image AddedImage Added

Number of
Visits by
Disease

The Number of Visits by Disease graph provides a breakdown of visits to the practice, in a selected time frame, by disease category.
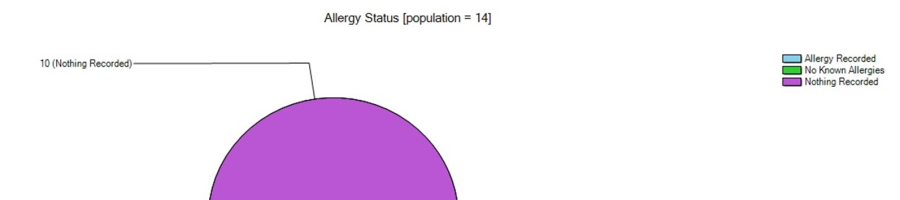
The disease categories provided are the current set of CAT disease categories.

Filter, as described above, to display a comparison of visit counts between the Provider and the Practice:

  • Visits time frame using the Date Range (Visits) filter
  • Visits to Any Provider using the Provider filter

Image Added

Clinical Graphs

The clinical graphs provided can be filtered, as above, by

  • Visits time frame using the Date Range (Visits) filter
  • Visits to Any Provider using the Provider filter


    This will provide information about data that has not been recorded in a patient's clinical record and provide a learning opportunity for Registrars.

Image AddedImage Added

...