The RACGP Quality Improvement & Continuing Professional Development (QI&CPD) triennium commenced 1 January 2017. The first activity in the QI&CPD program is the PLAN Quality improvement activity which is an acronym for ‘planning, learning and need’.
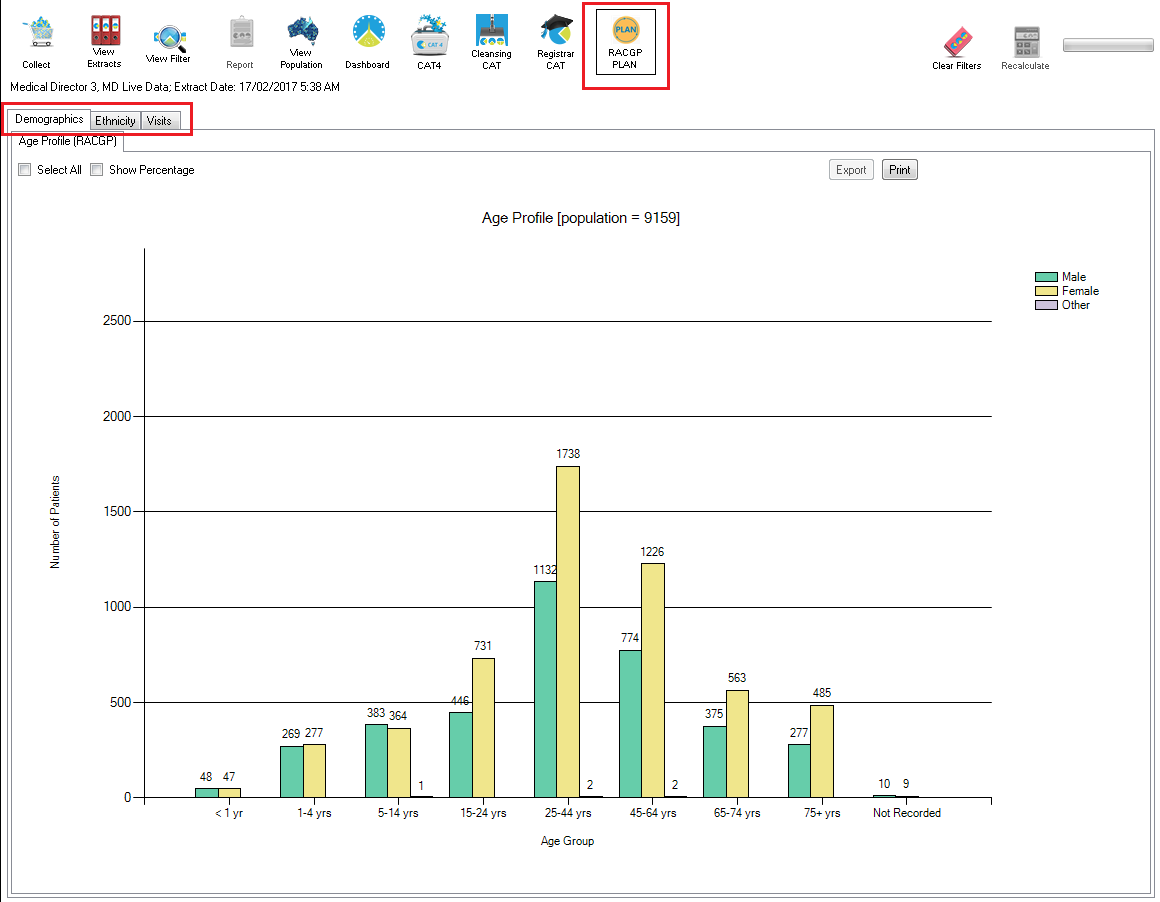
To access the reports relevant to the activities, CAT4 provides a new program under the programs icon on the dashboard.

This will show all available programs - choose the RACGP Plan to see the reports:
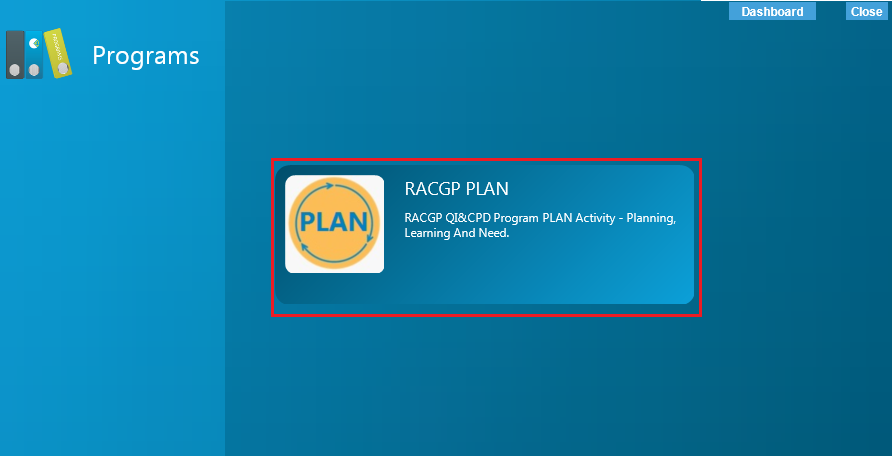
Once clicked, CAT4 will show only the reports under the RACGP Plan.
Within the PLAN activity, the GP must complete the Practice Profile and Self-Reflection questions which are listed below together with the respective reports.
Think about your patient age groups compared to the Australian average.
Question: What is the age distribution of your patients? Out of every 100 patients you see, on average, how many do you see whose ages are...?
Age Profile (RACGP) This tab shows a bar chart of patients by age and gender grouped in age groups tailored to the RACGP Quality Improvement & Continuing Professional Development plan. This report will enable participants to answer the questions about the age of the patients attending the practice or seen by a particular provider. Filters can be used to show only a particular group of patients such as those assigned to one provider or those visited in a particular time period only.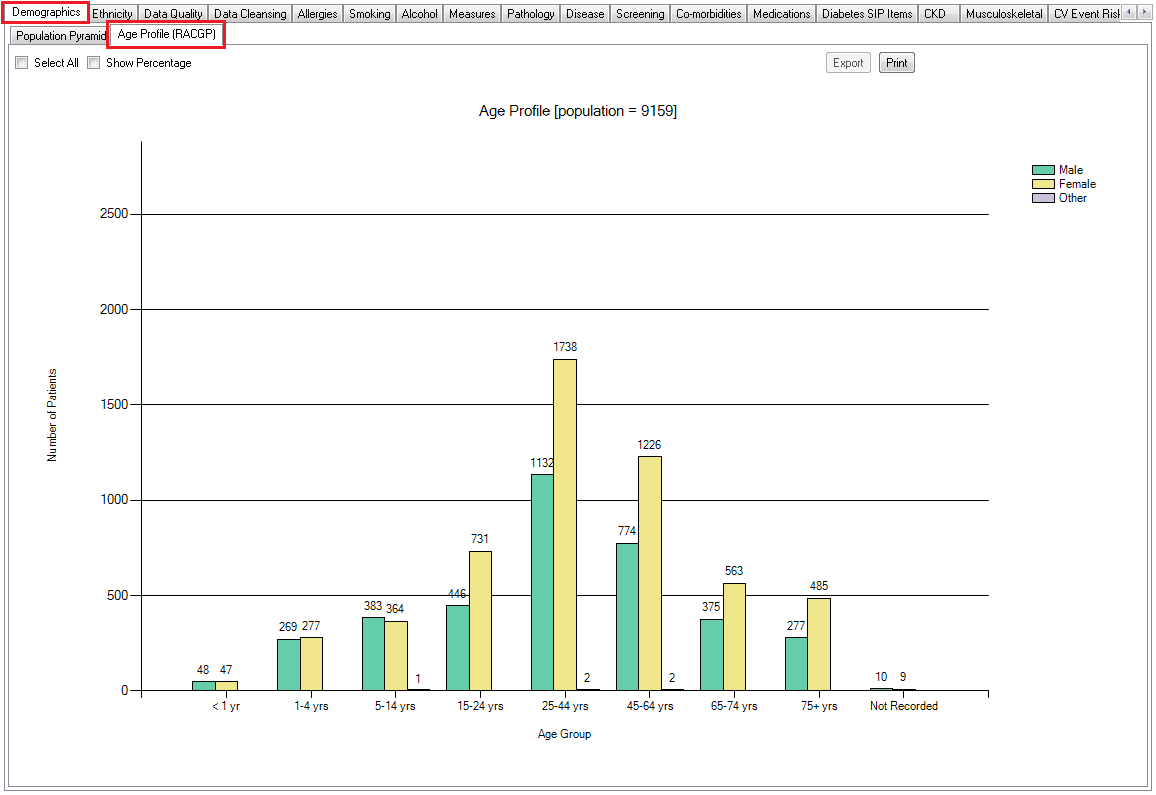
Think about the cultural and ethnic groups you commonly see in your practice. The classification used is according to the Australian standard classification of cultural and ethnic groups (ASCCEG) 1249.0.
Question: Enter between 3 and 10 cultural/ethnic groups that have an impact on your practice
Think about the Aboriginal and Torres Strait Islander patients in your practice compared to the Australian average
Question: What percentage of your total patient base are Aboriginal or Torres Strait Islander?
Use the two tabs on the Ethnicity report to answer the questions above.
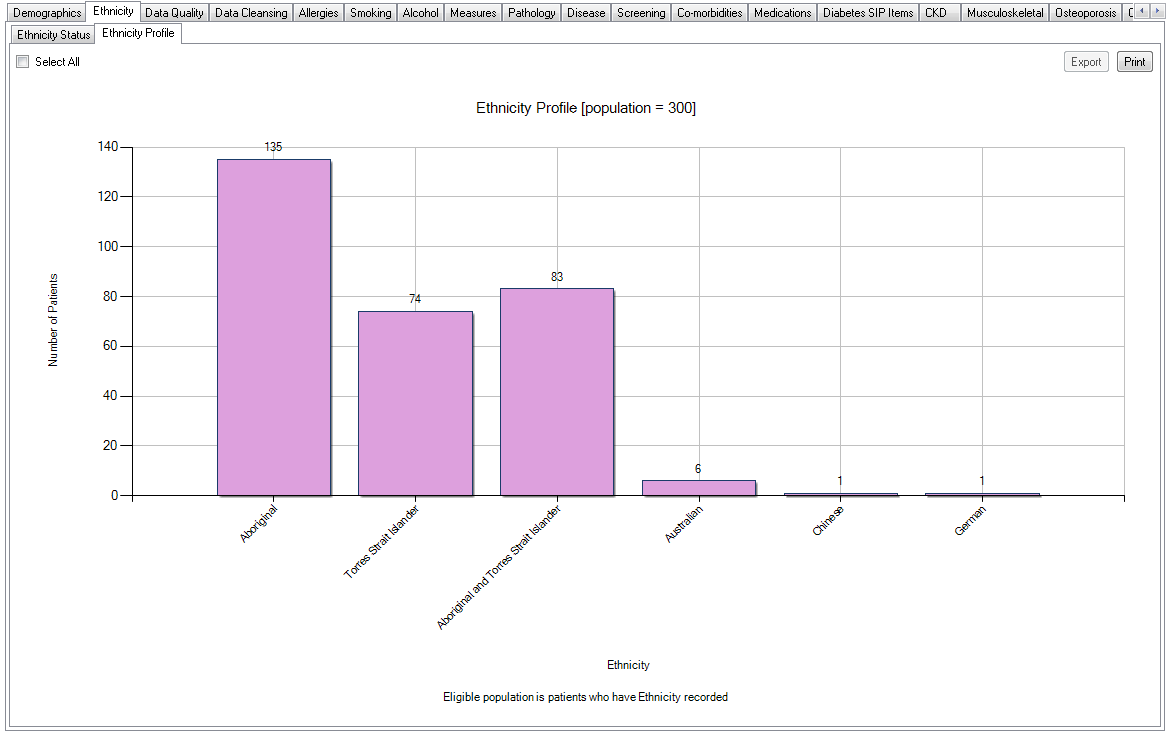
The Ethnicity Status tab shows a breakdown of the patients by their indigenous status and lists the following details: The Ethnicity Profile shows all countries/ethnicities entered in the patient record and a bar chart of this information.
The Ethnicity tab displays your data on two tabs: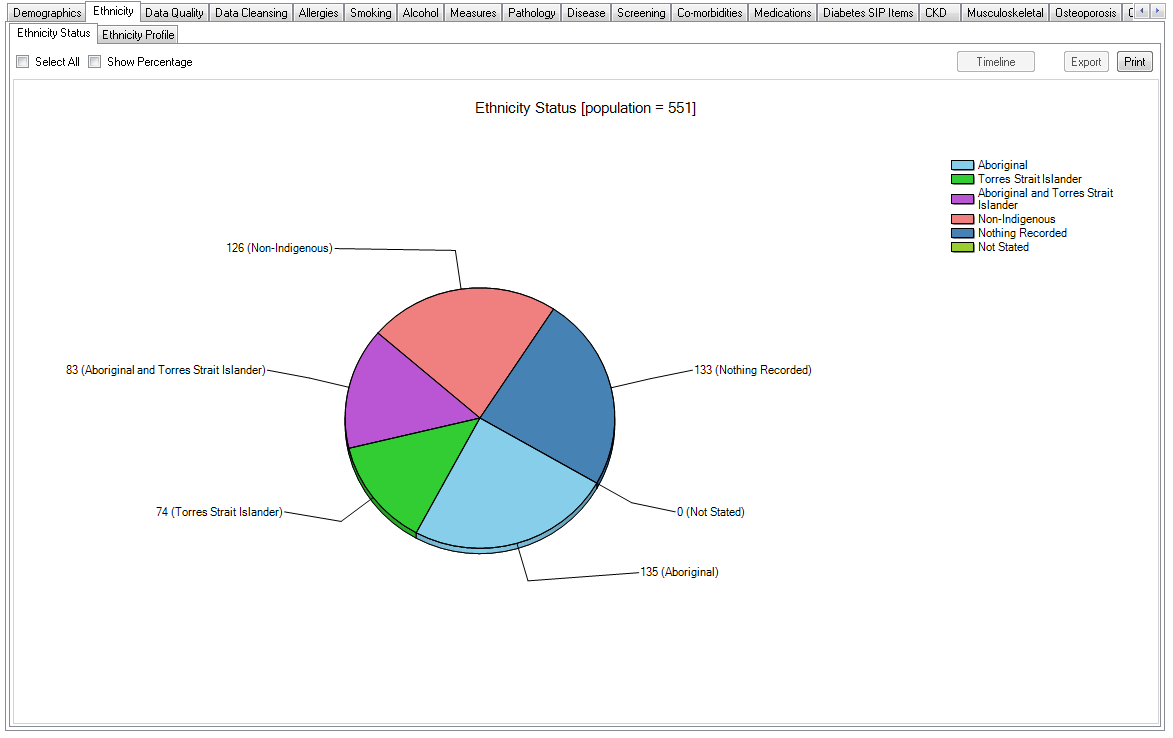
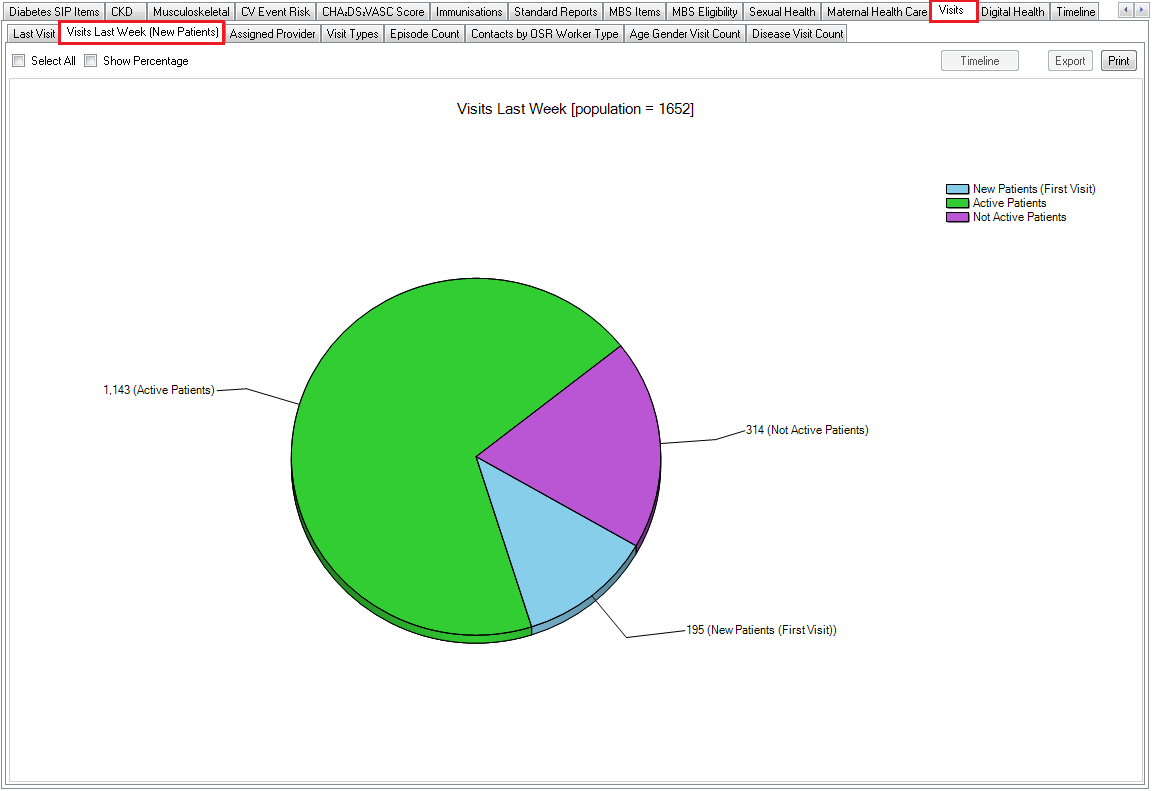
Think about the number of new patients you would see in an average week
Question: How many new patients would you see for every 100?
To see the answer in percentage (every 100) click on the 'Show Percentage' box to toggle the view from count to percentage.