Page History
...
These reports have been created as a response to the PIP QI ten improvement measures. PAT CAT will show a report for each improvement measure and show the details for each measure with the defined filter criteria applied. Further filtering is possible but not required, as the reports match the definition provided by the department of health. All reports can be downloaded as CSV for further analysis or as an image for inclusion in reports. Only practices enrolled in PIP QI are shown!
| Excerpt Include | ||||||
|---|---|---|---|---|---|---|
|
...
Here is a list of all available reports in the PAT CAT PIP QI Professional module.
PIP QI Summary Report
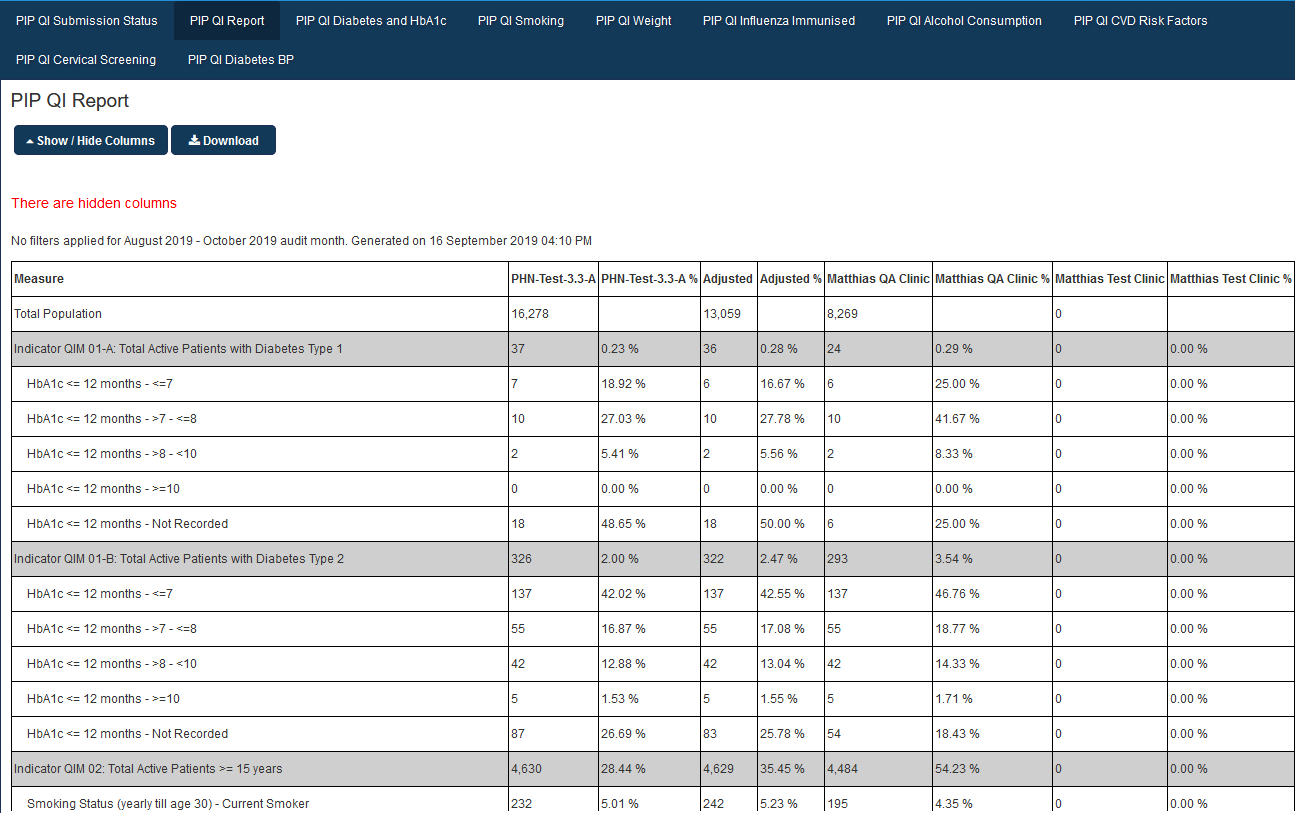
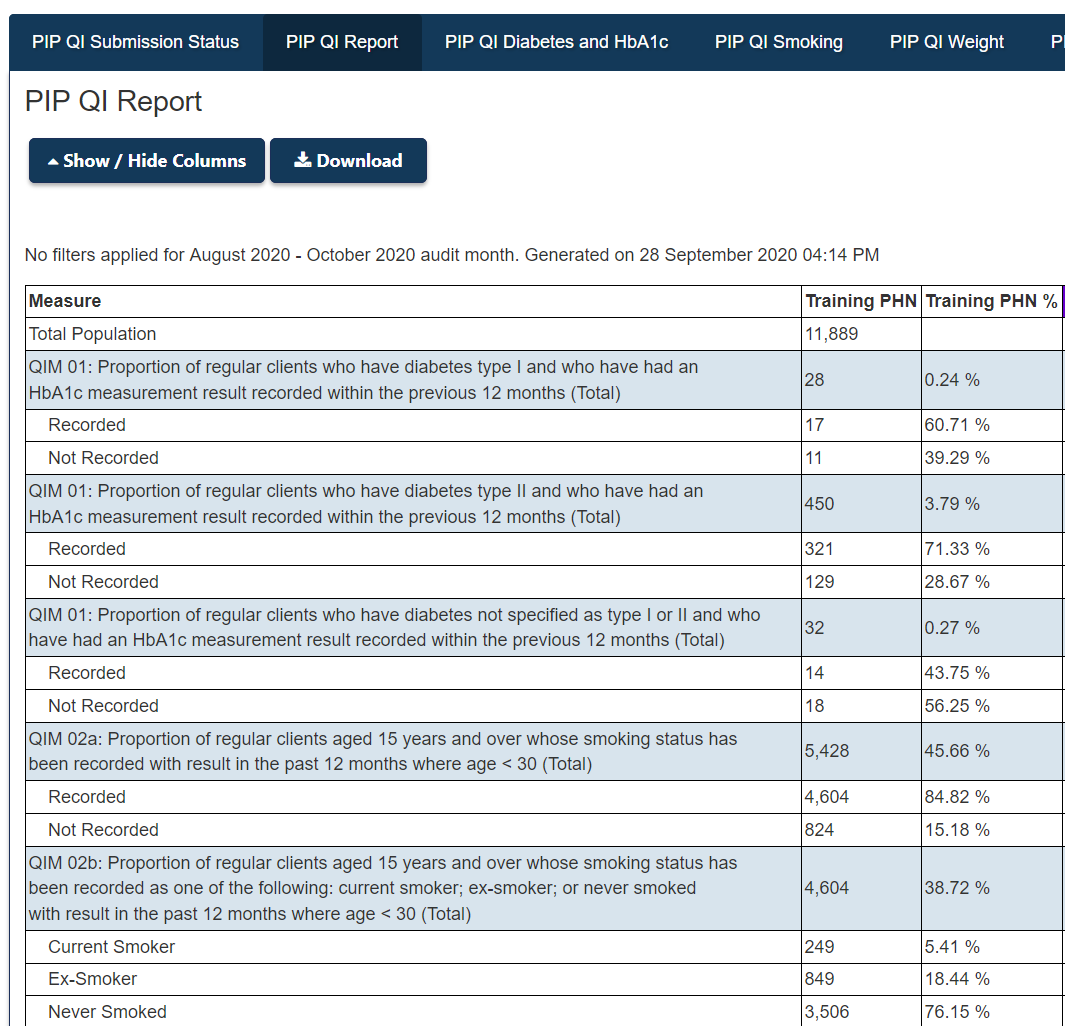
This summary report provides an aggregate view of all ten indicators broken down in the individual report categories. Totals for the PHN as well as the details for each PIP QI enrolled practice are shown.
| Warning |
|---|
| Details of denominators and exclusions are listed on each graph and have been specified by the department of health .in May 2020 |
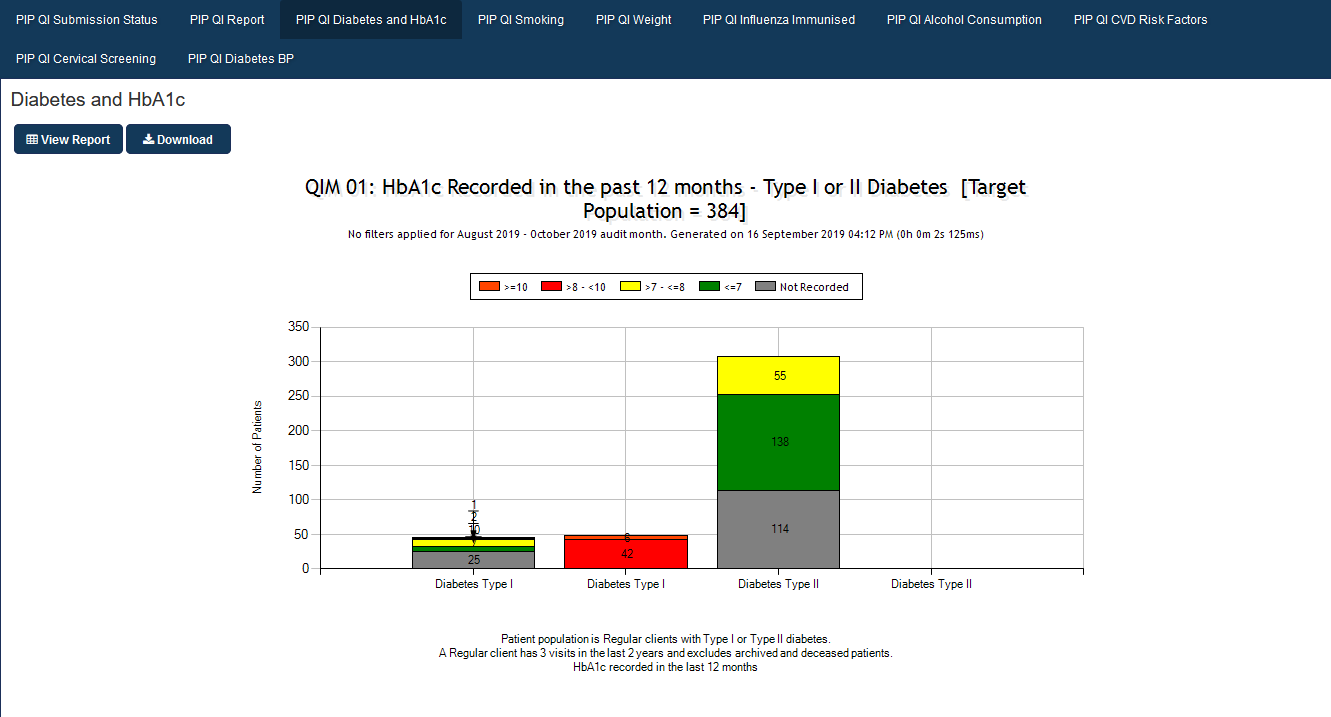
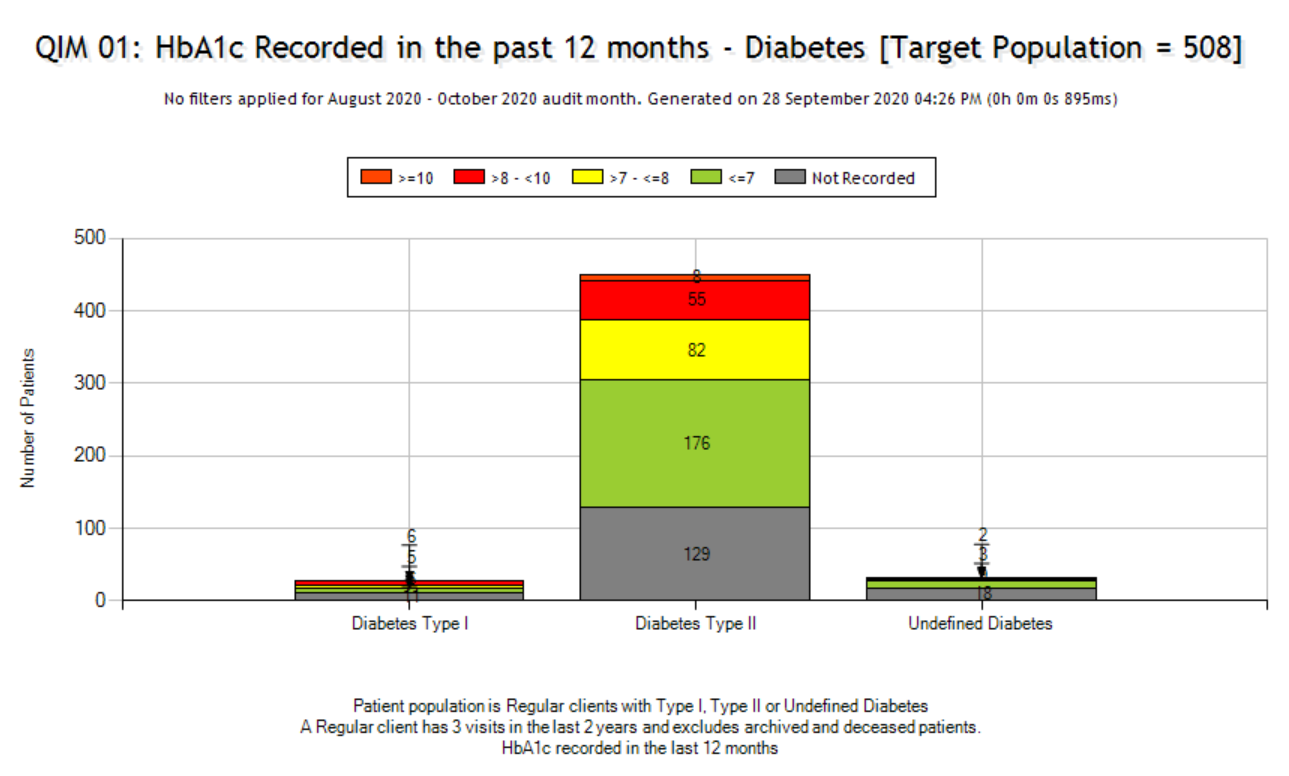
PIP QI Diabetes and HbA1c
Diabetes and HbA1c - regular patients with diabetes type 1 or type 2 and their HbA1c result in the last 12 months.
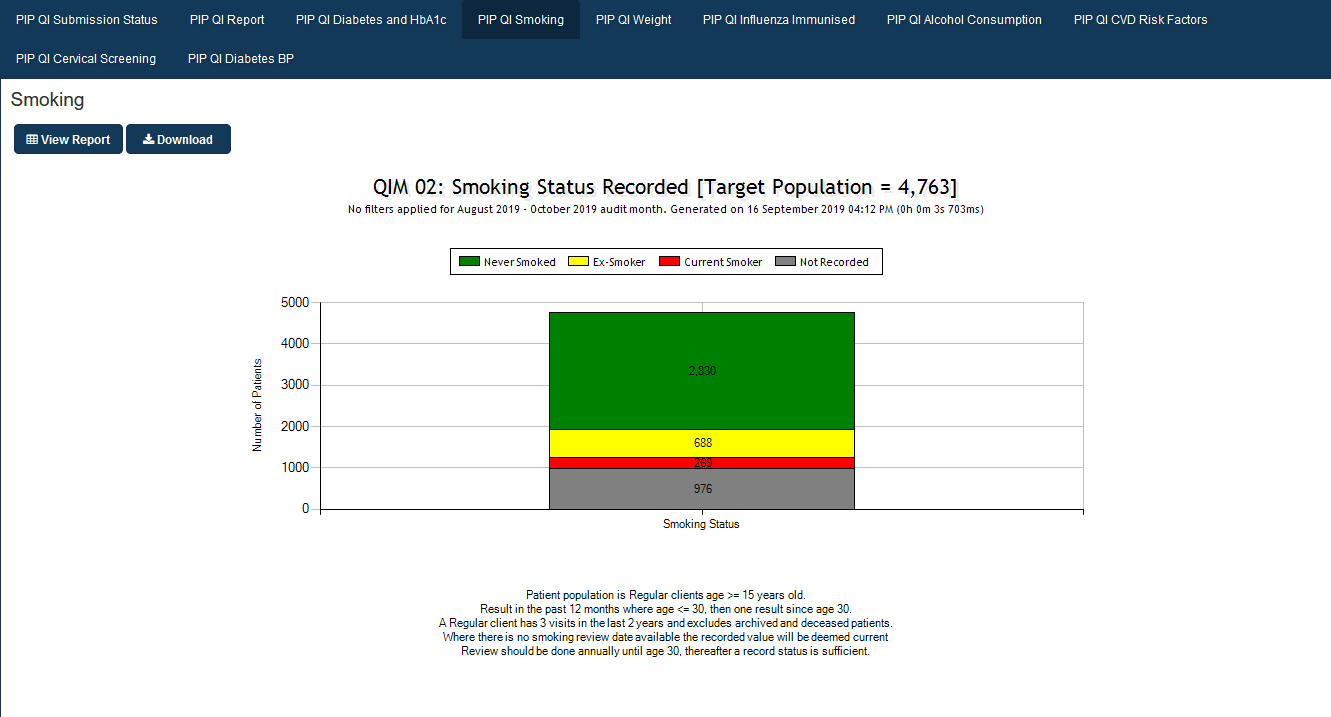
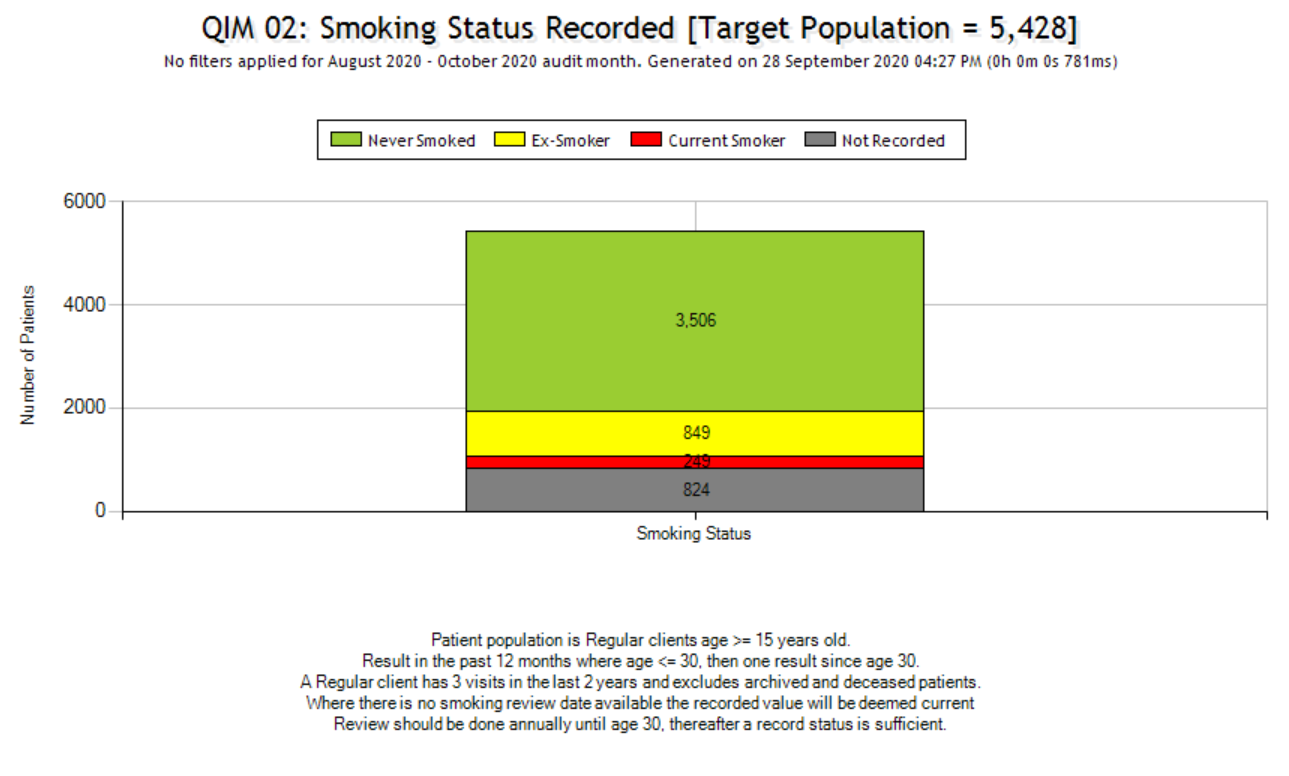
PIP QI Smoking
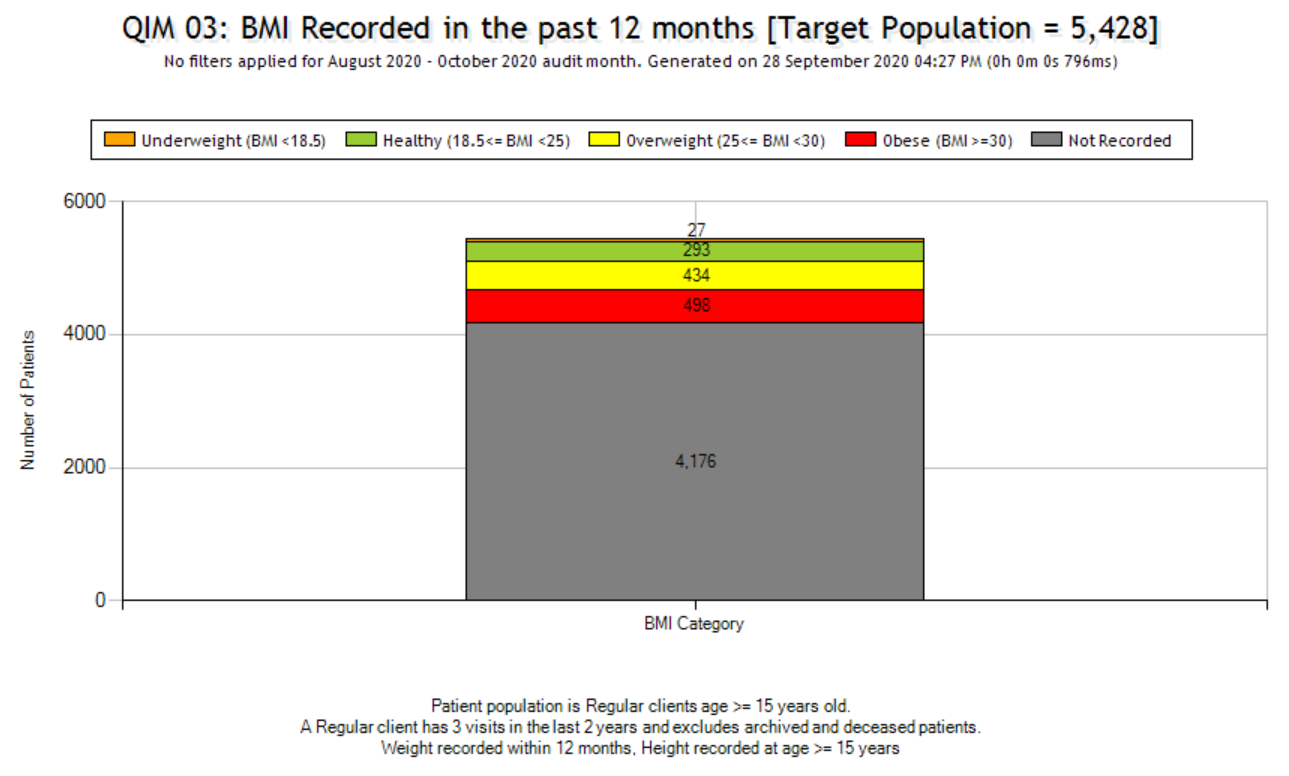
PIP QI Weight

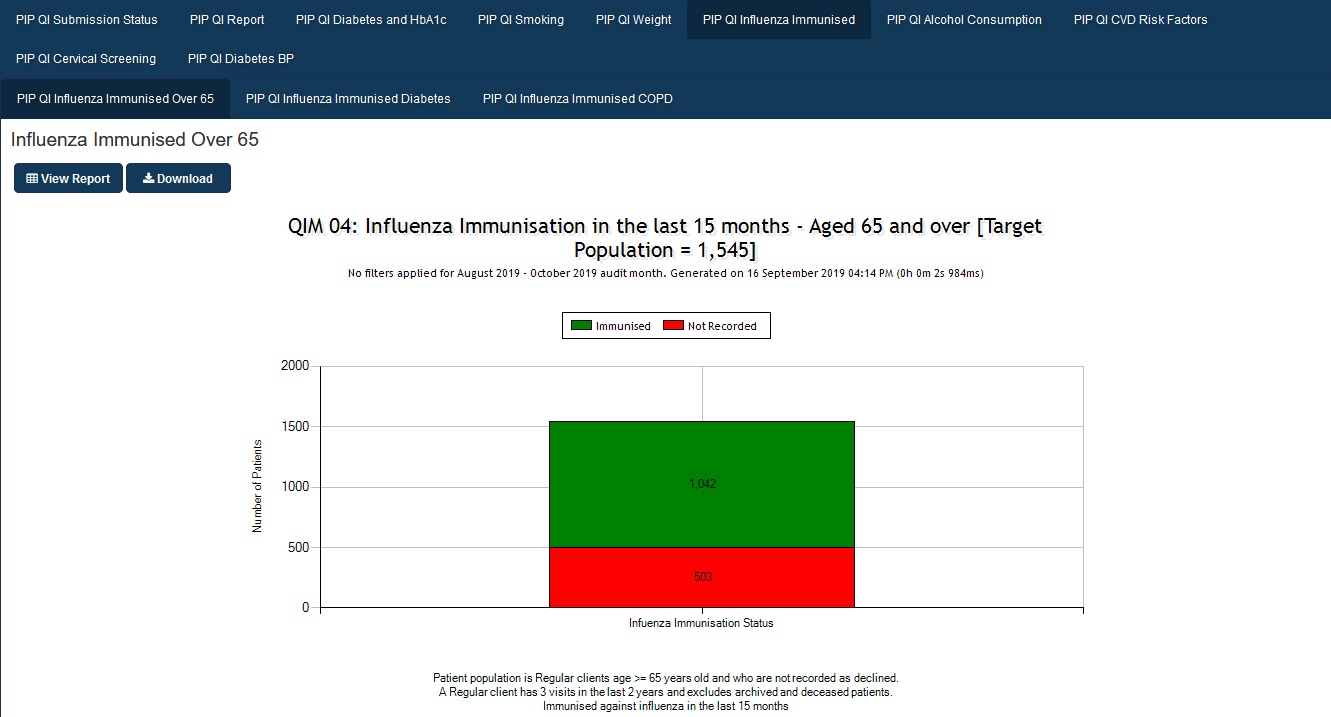
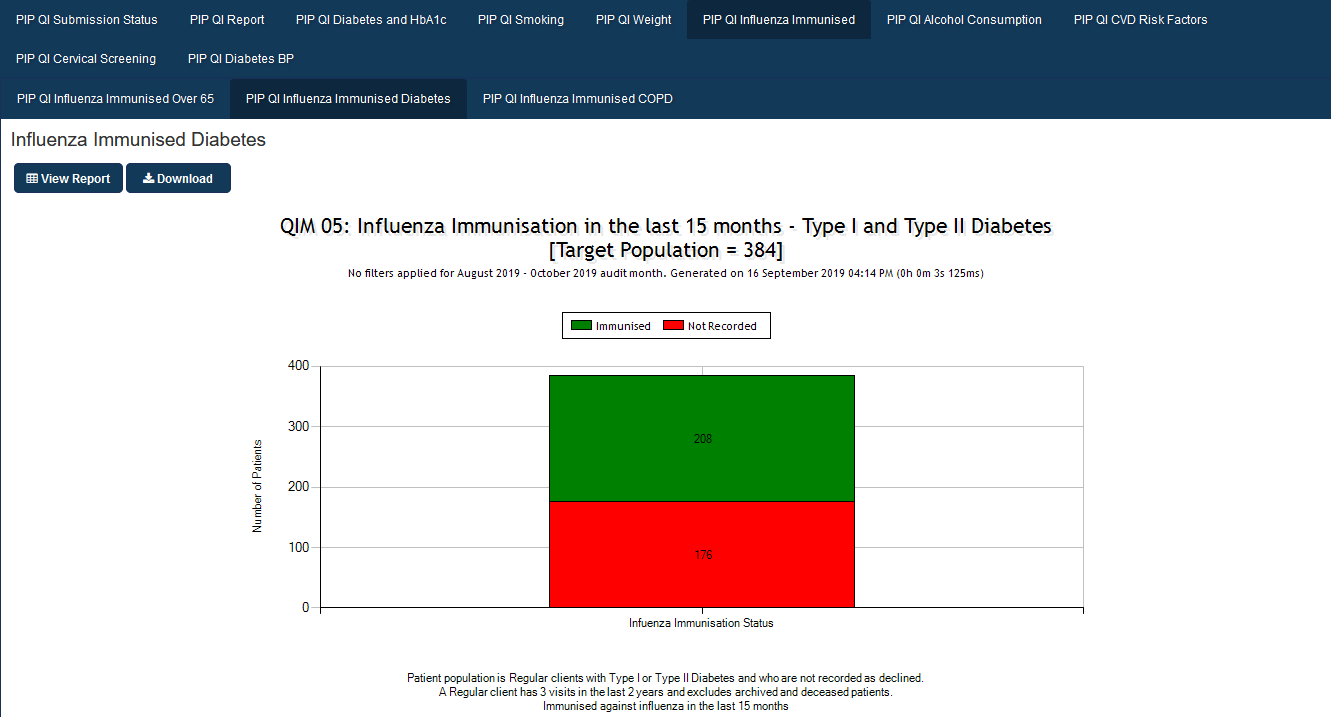
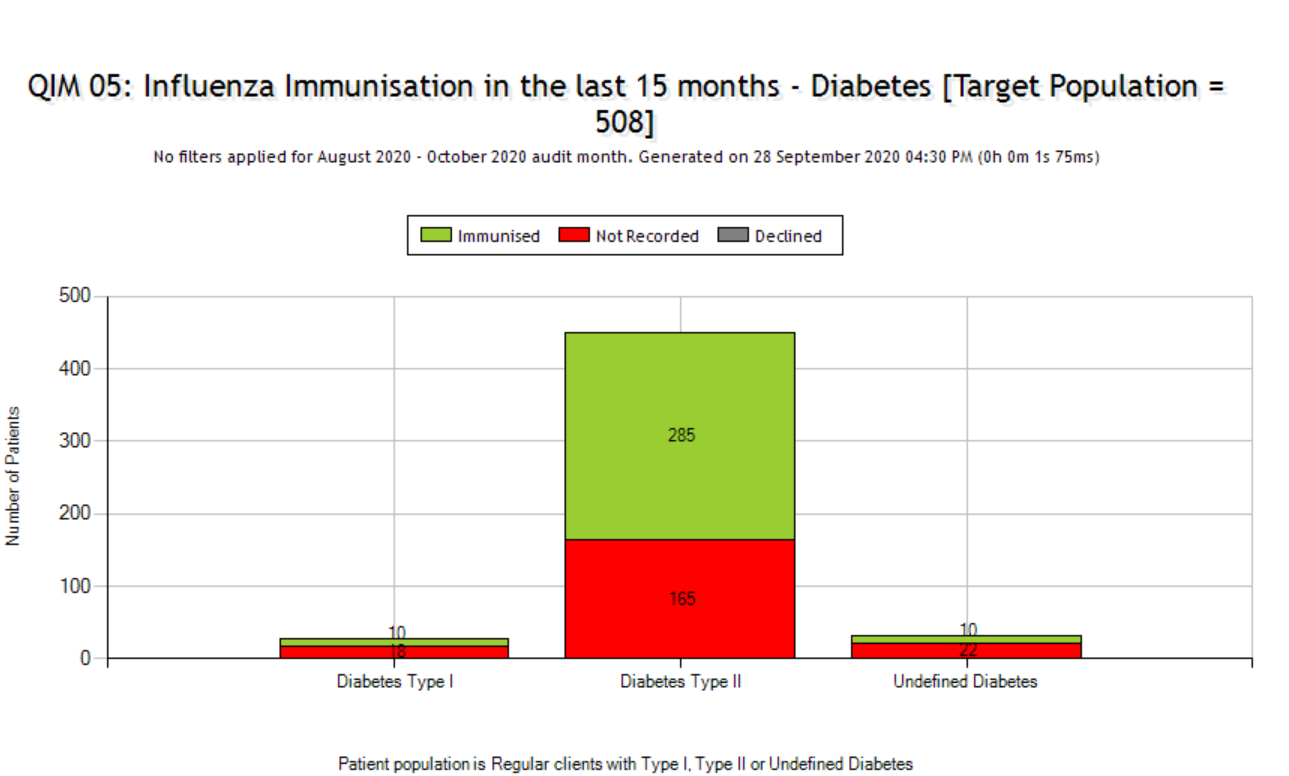
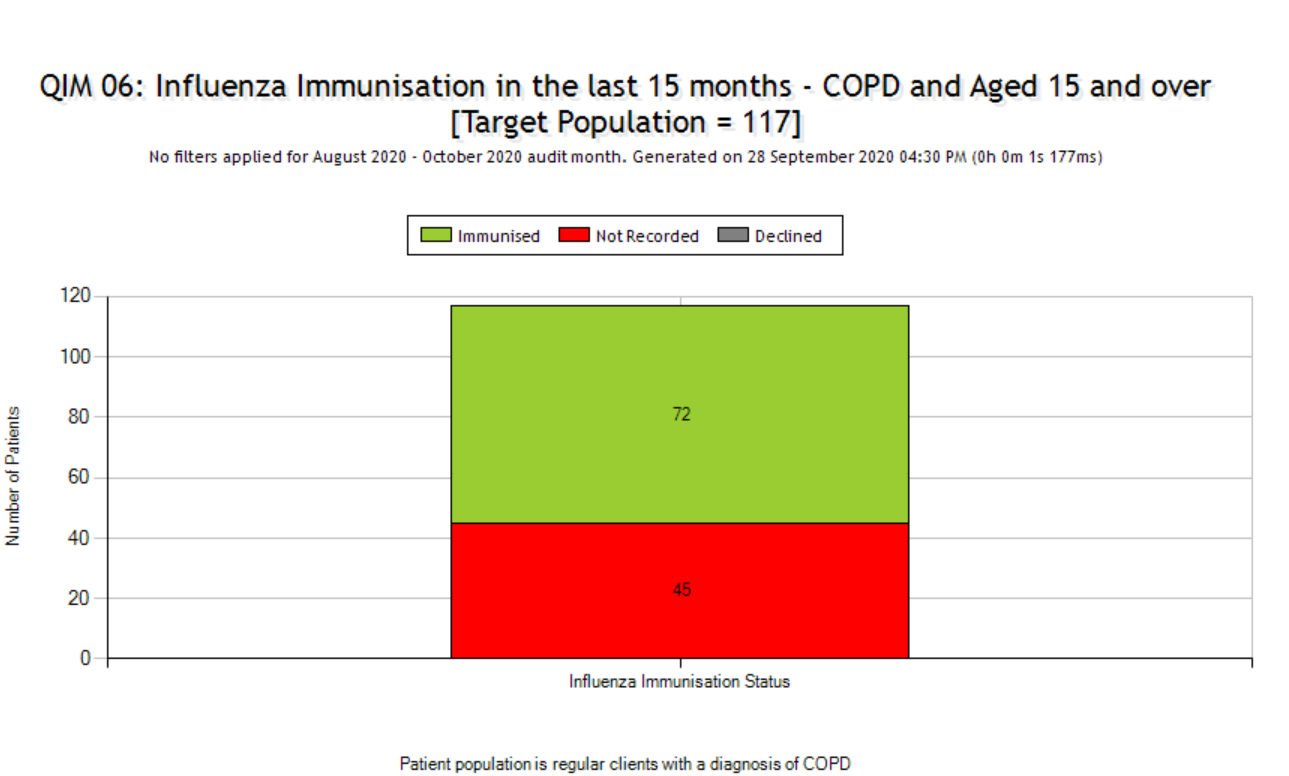
PIP QI Influenza Immunised
Please note that there are three tabs to show reports for patients aged >=65, patients with diabetes and patients with COPD
Over 65 years old:

Diabetes Type I or Type II:
COPD:
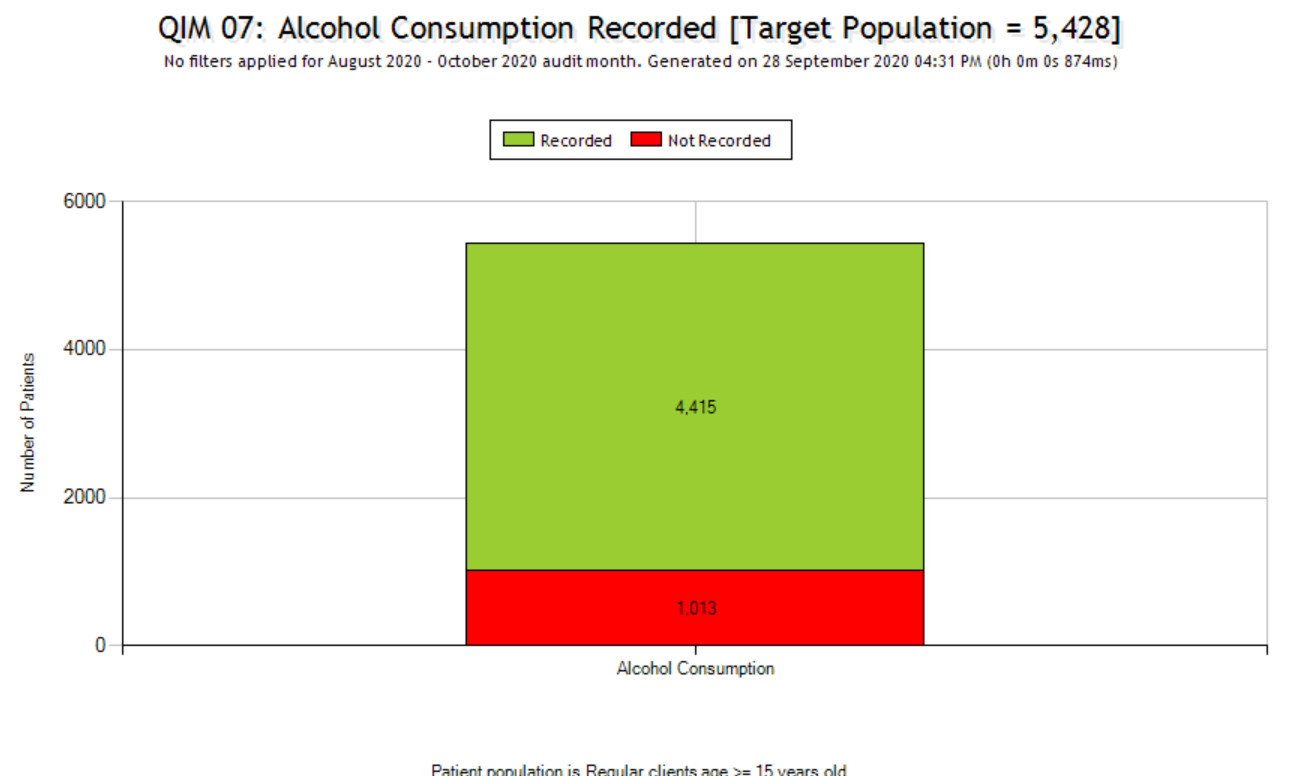
PIP QI Alcohol Consumption
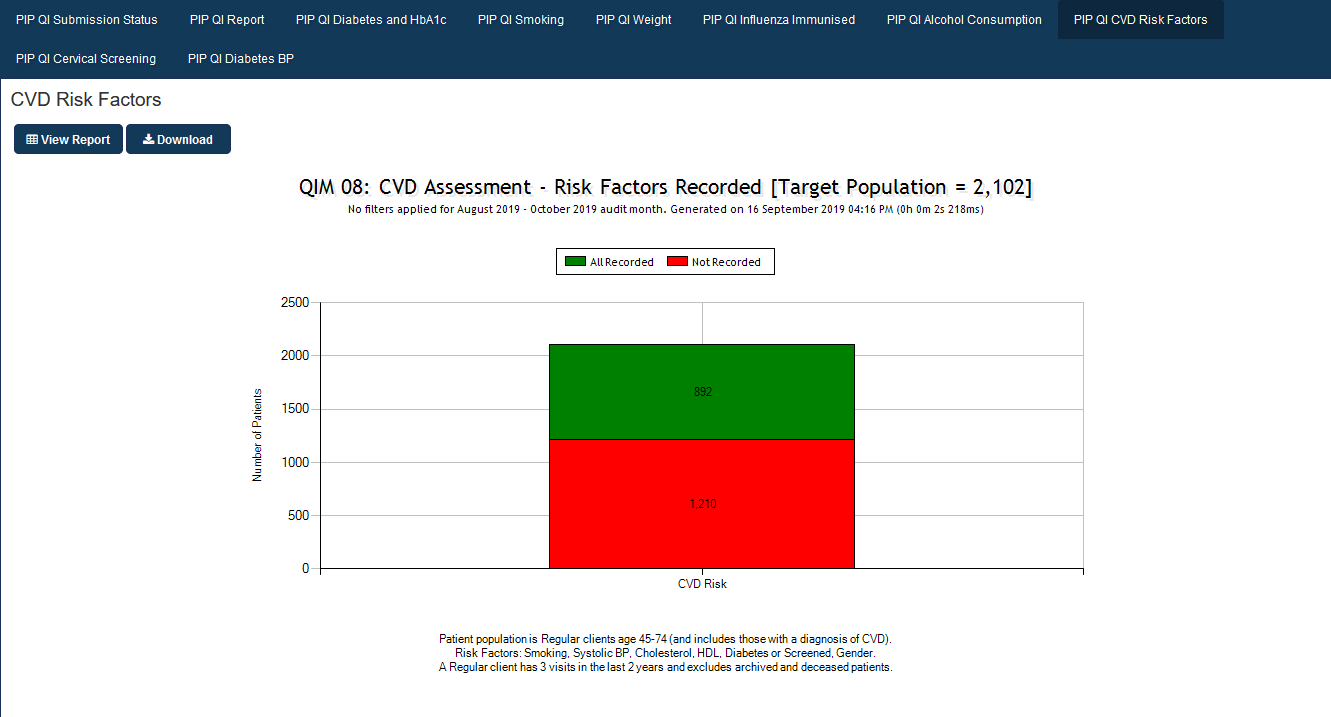
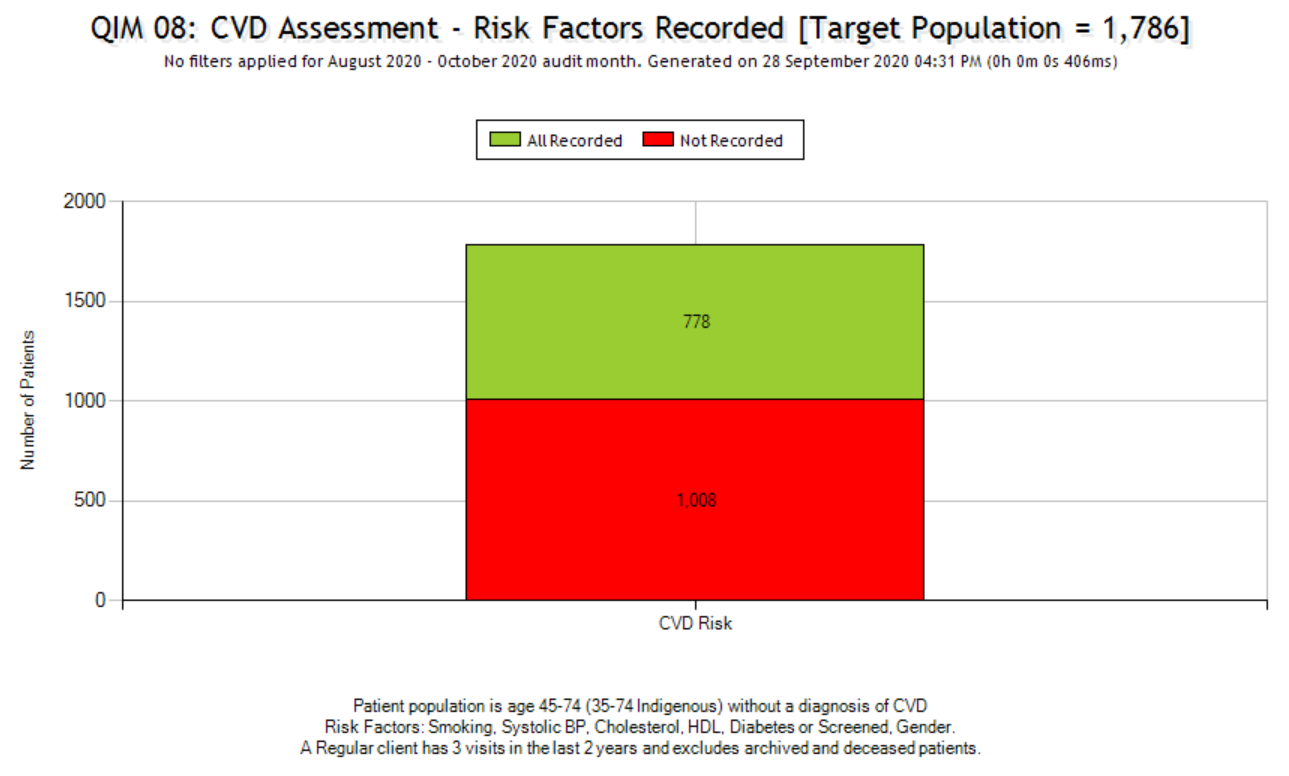
PIP QI CVD Risk Factors
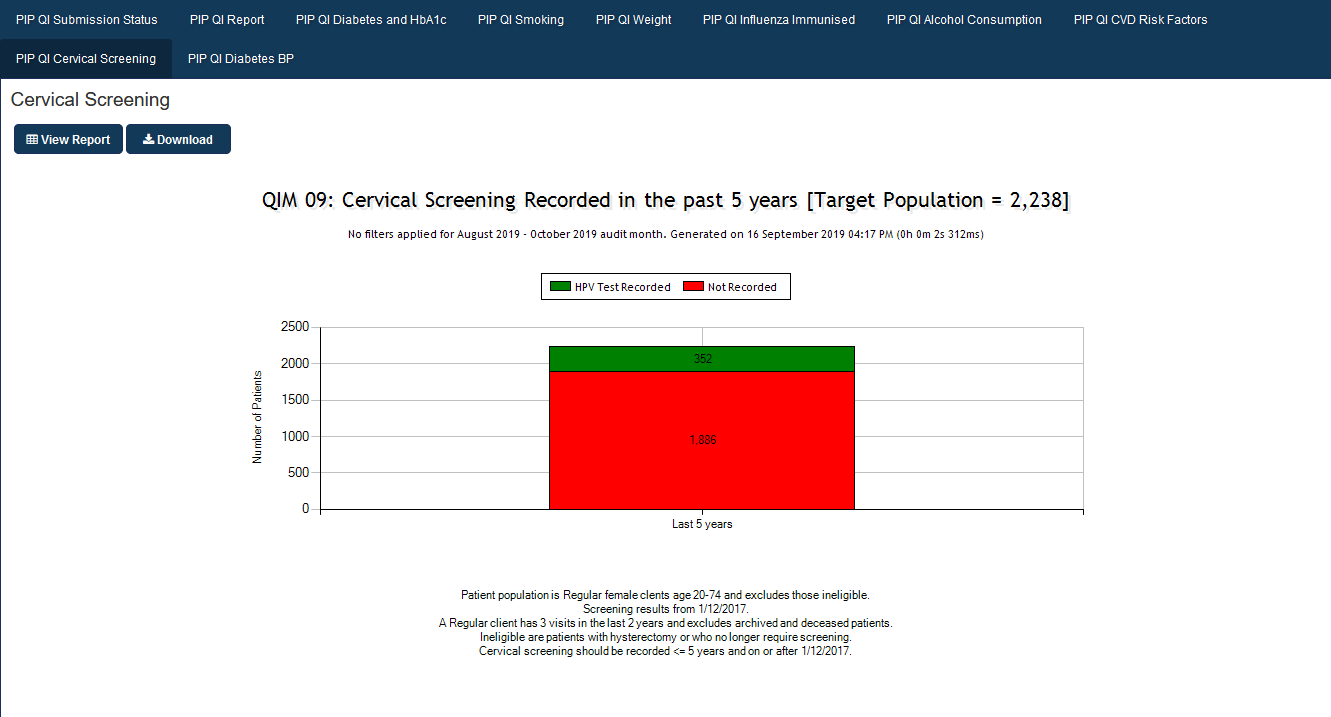
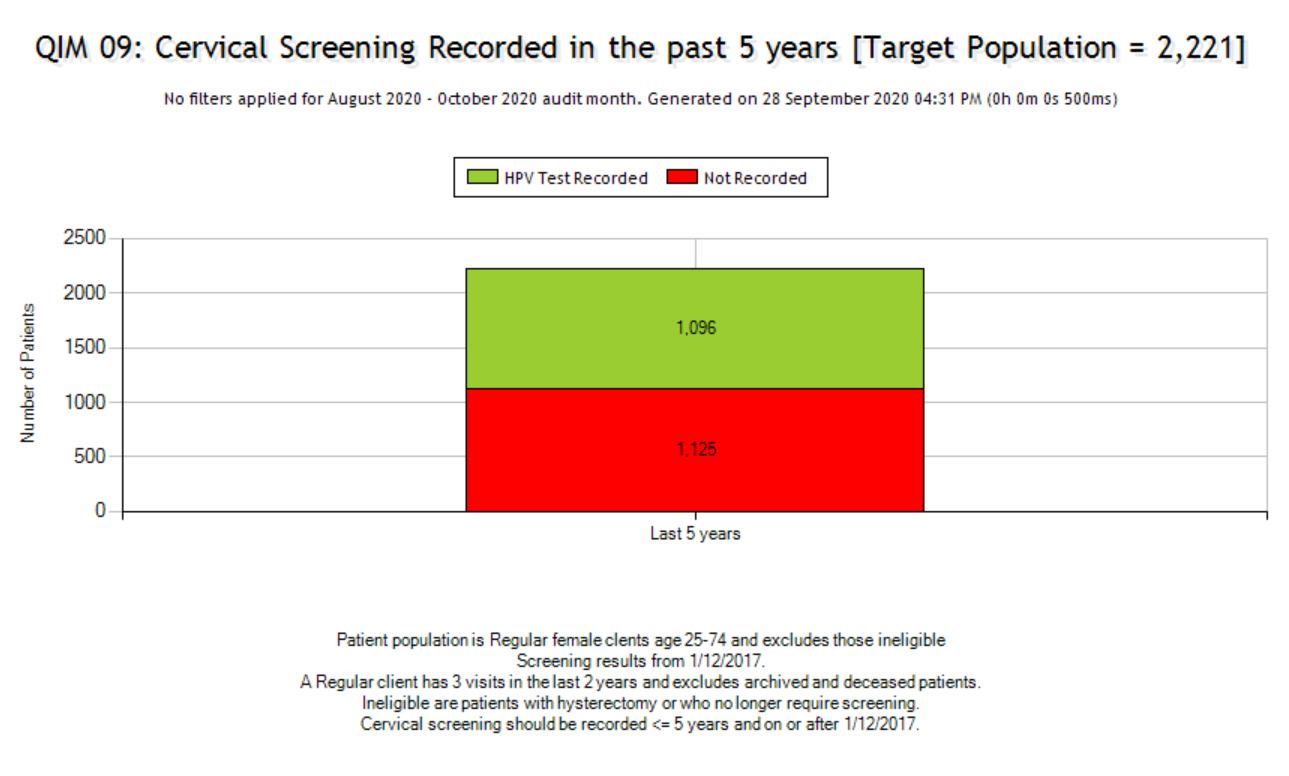
PIP QI Cervical Screening
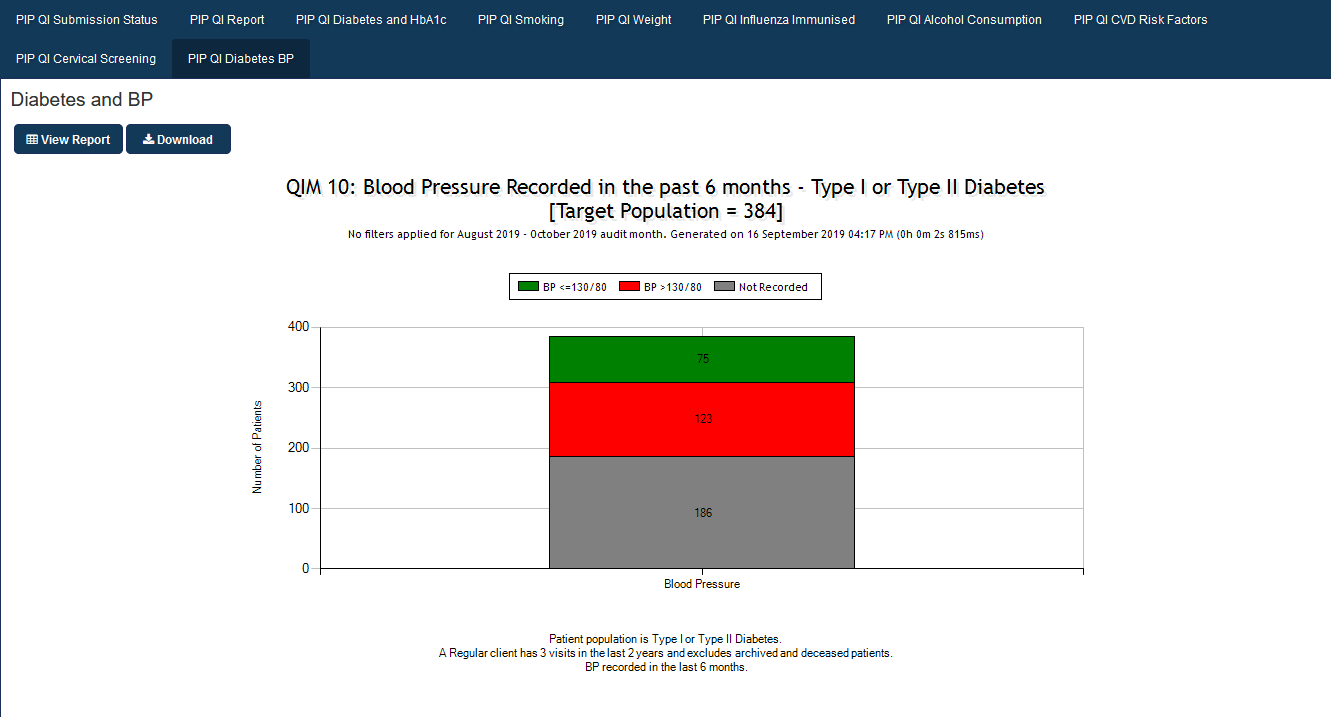
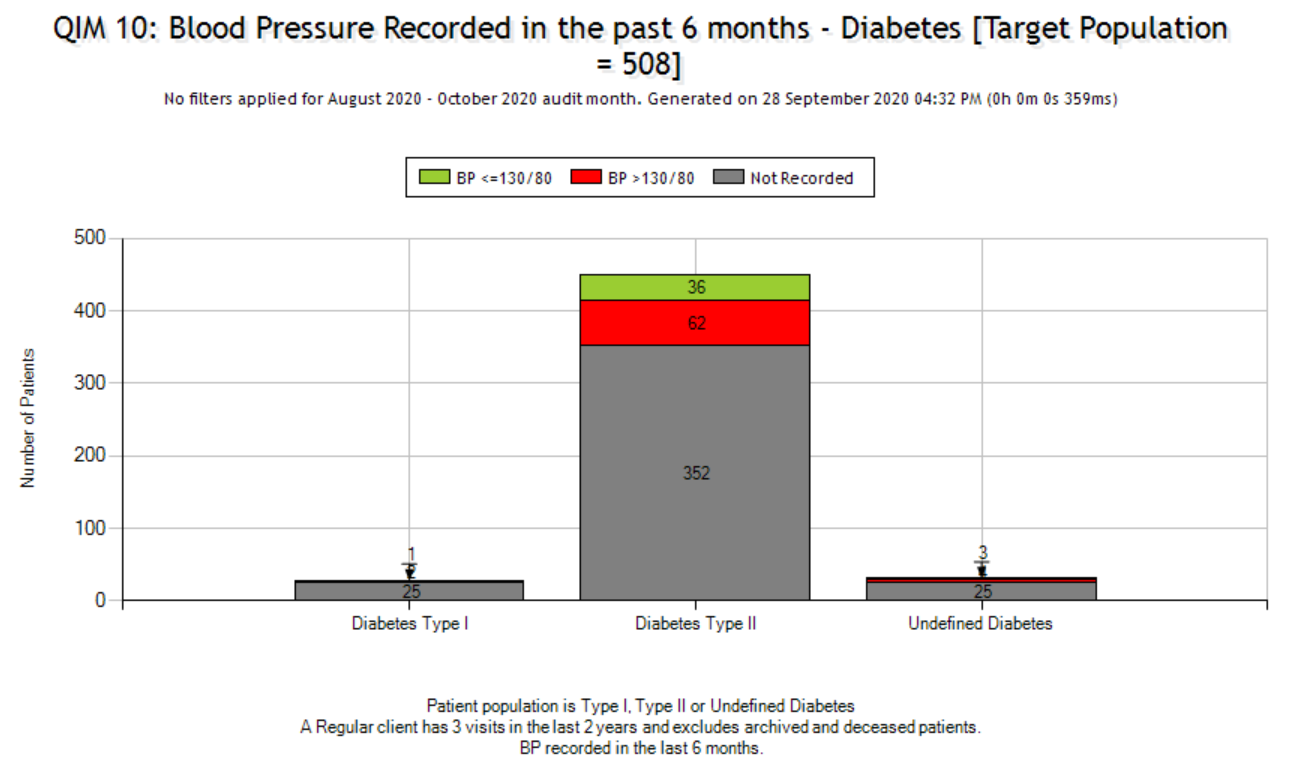
PIP QI Diabetes and Blood Pressure