Page History
Ethnicity is displayed as a pie chart with the pie chart breaking down the population by Aboriginal and Torres Strait Islander, Aboriginal, Torres Strait Islander, Non-Indigenous and Not Recorded. 
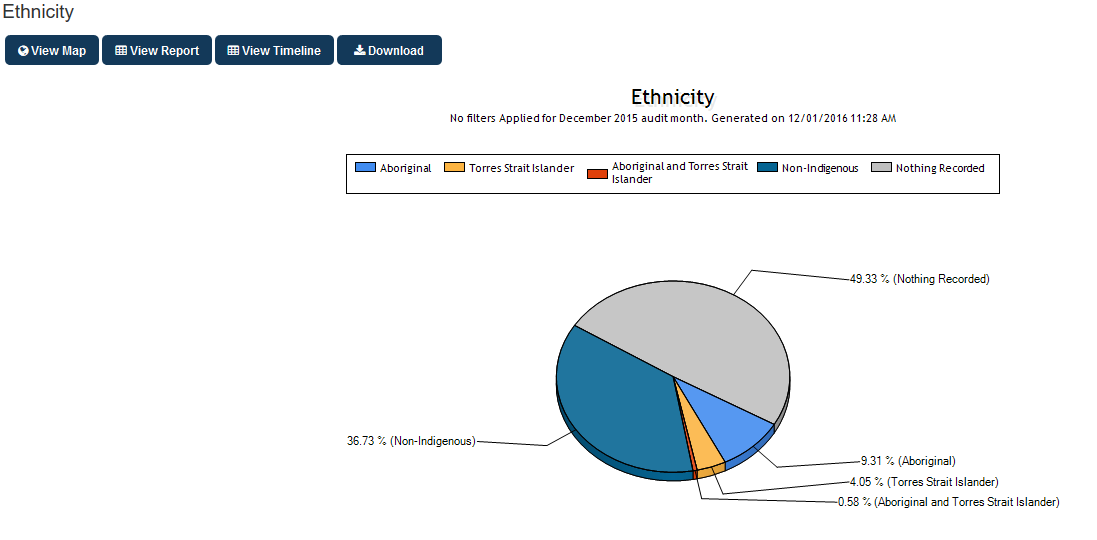
Figure 99: Ethnicity Report
Ethnicity is displayed as a pie chart with the pie chart breaking down the population by Aboriginal and Torres Strait Islander, Aboriginal, Torres Strait Islander, Non-Indigenous and Not Recorded.
Figure 99: Ethnicity Report