Page History
Recipe Name: | QIM 8 – Cardiovascular Risk |
Rationale: | Assessment of absolute CVD risk based on multiple risk factors is more accurate than that based on individual risk factors due to the cumulative nature of risk effects. Basing patient management decisions on this approach should improve CVD outcomes. |
Target: |
Anyone with an existing cardiovascular conditions is excluded from this report. |
CAT Starting Point: |
|
The CV even risk report in CAT4 shows the risk level of patients based on the National Vascular Disease Prevention Alliance (NVDPA) guidelines: https://www.cvdcheck.org.au/australian-absolute-cardiovascular-disease-risk-calculator
...
- Active selected on the General Filter tab
- Click "Recalculate"
- Click ‘Hide Filters’
Report Steps
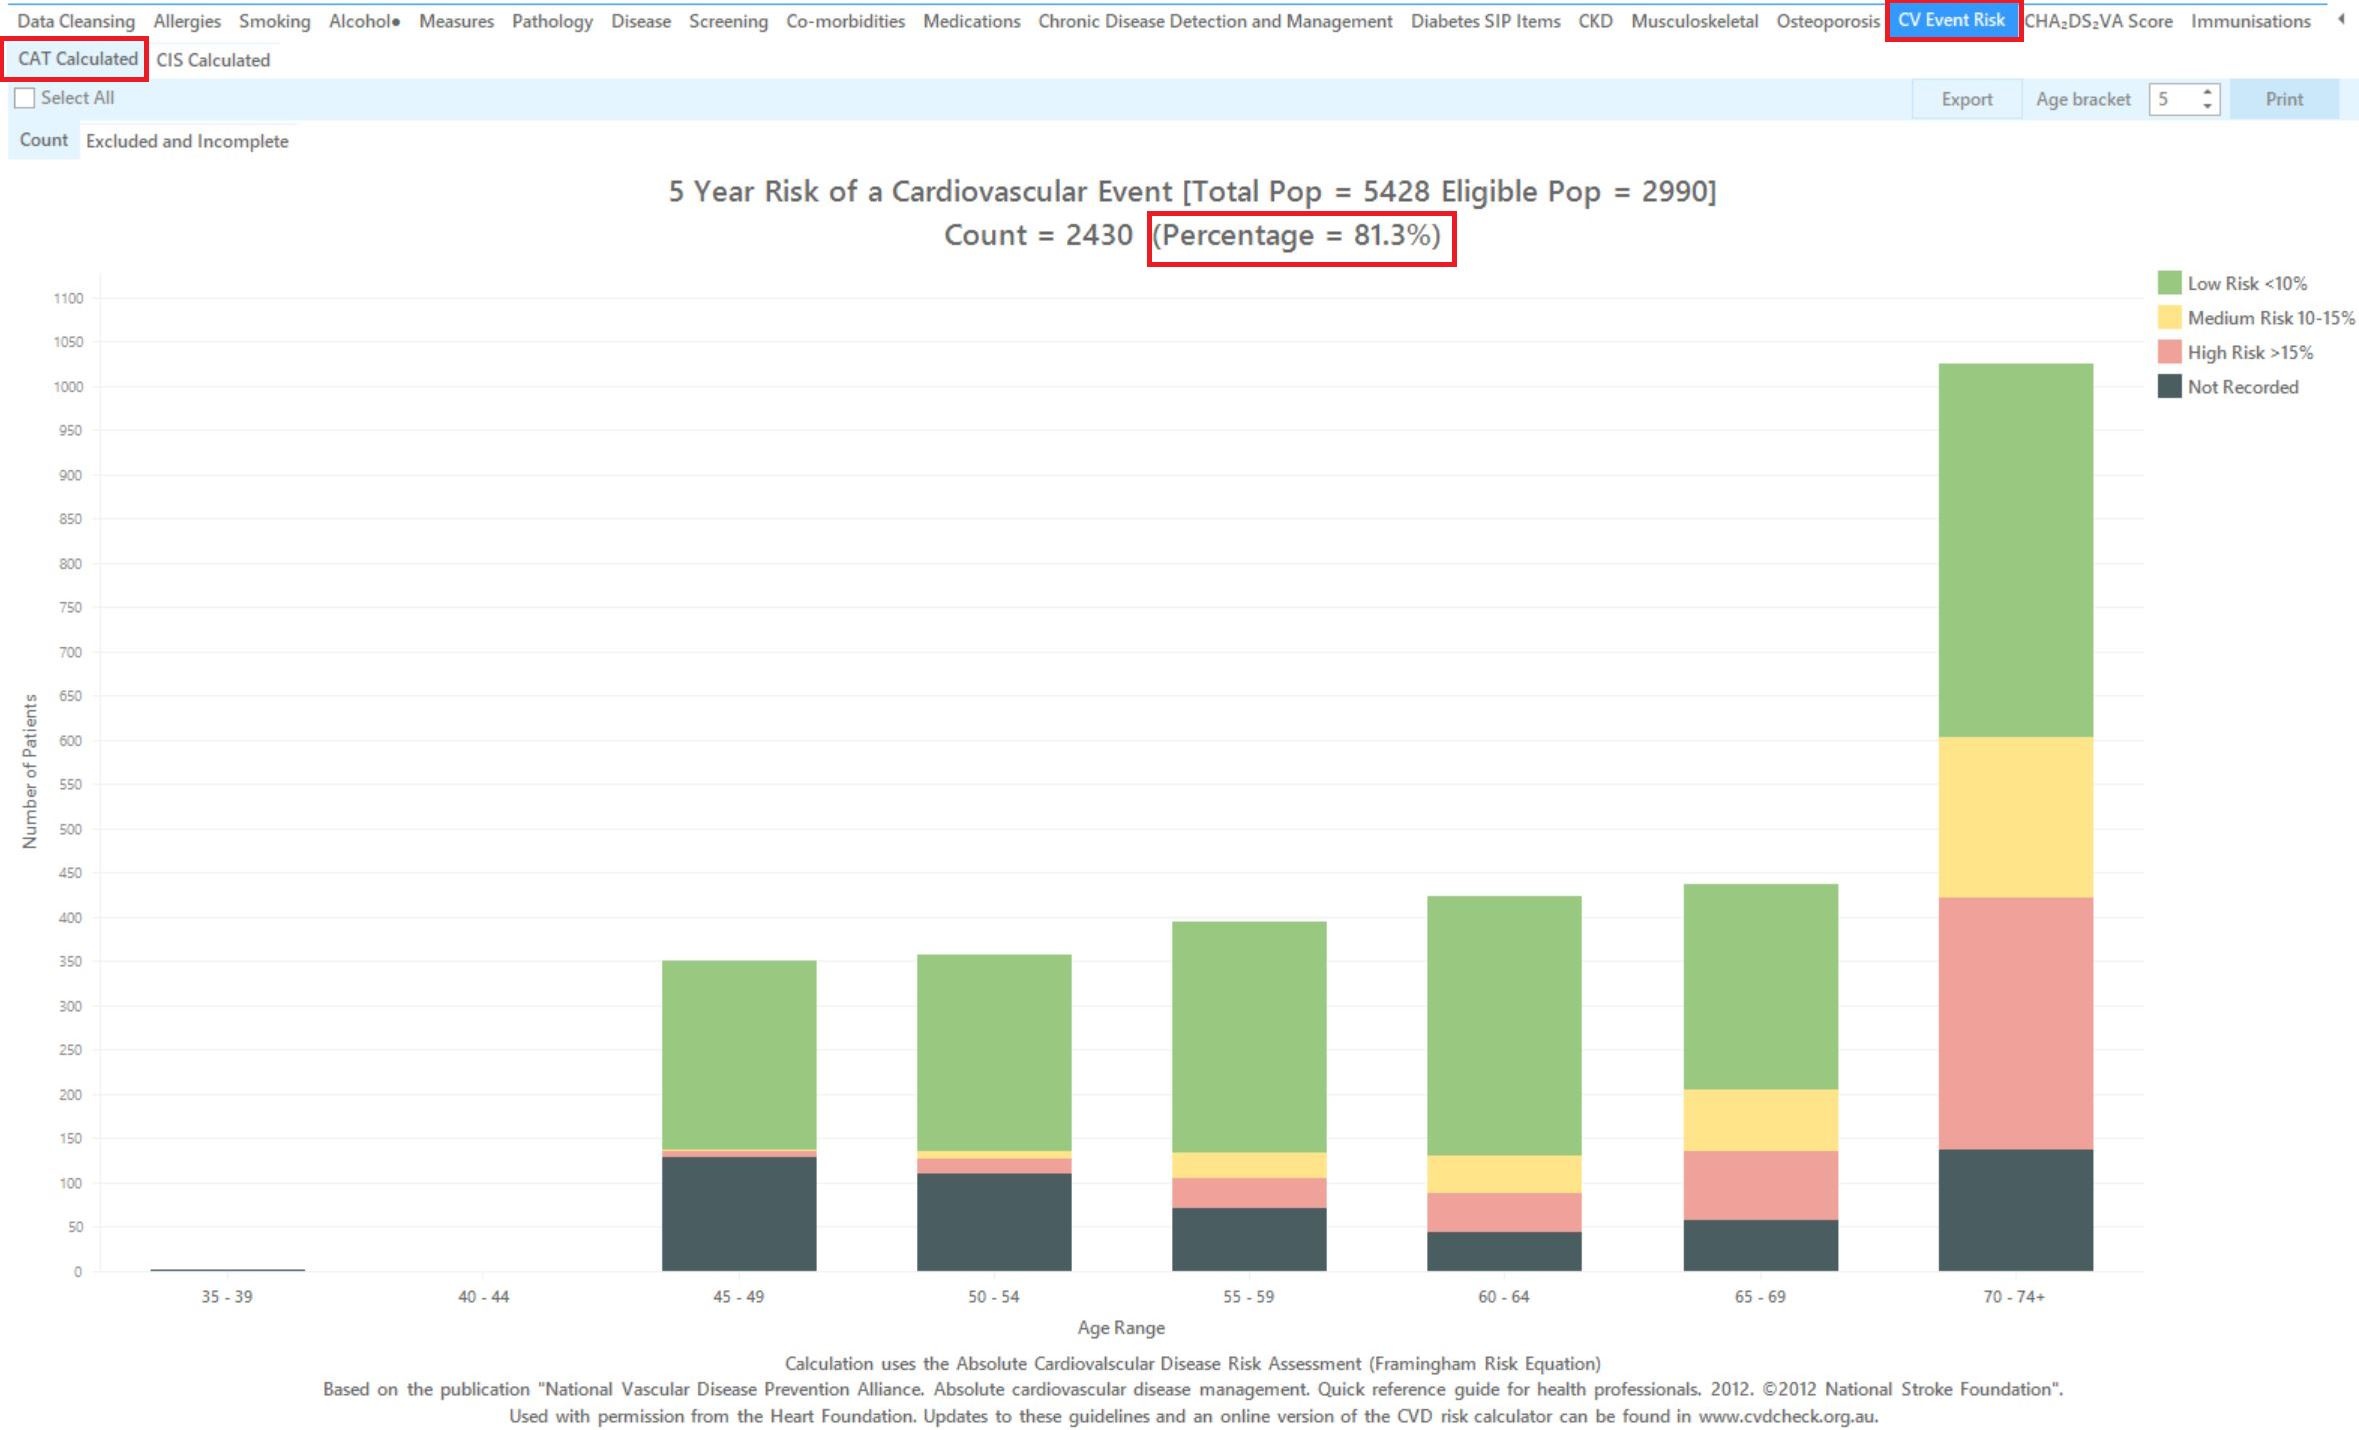
- Select the "CV Event Risk" tab
...
The title of the report shows the number of patients matching the search criteria, in this case 2002 regular patients aged between 45 and 74 years. Out of those 1848 are eligible for the risk calculation as they don’t have a diagnosis of a cardiovascular condition. Out of the 1848 eligible patients 1299 or 70.3% have all measures in place to calculate their CV Event risk.
The next tab shows excluded and incomplete patient records:
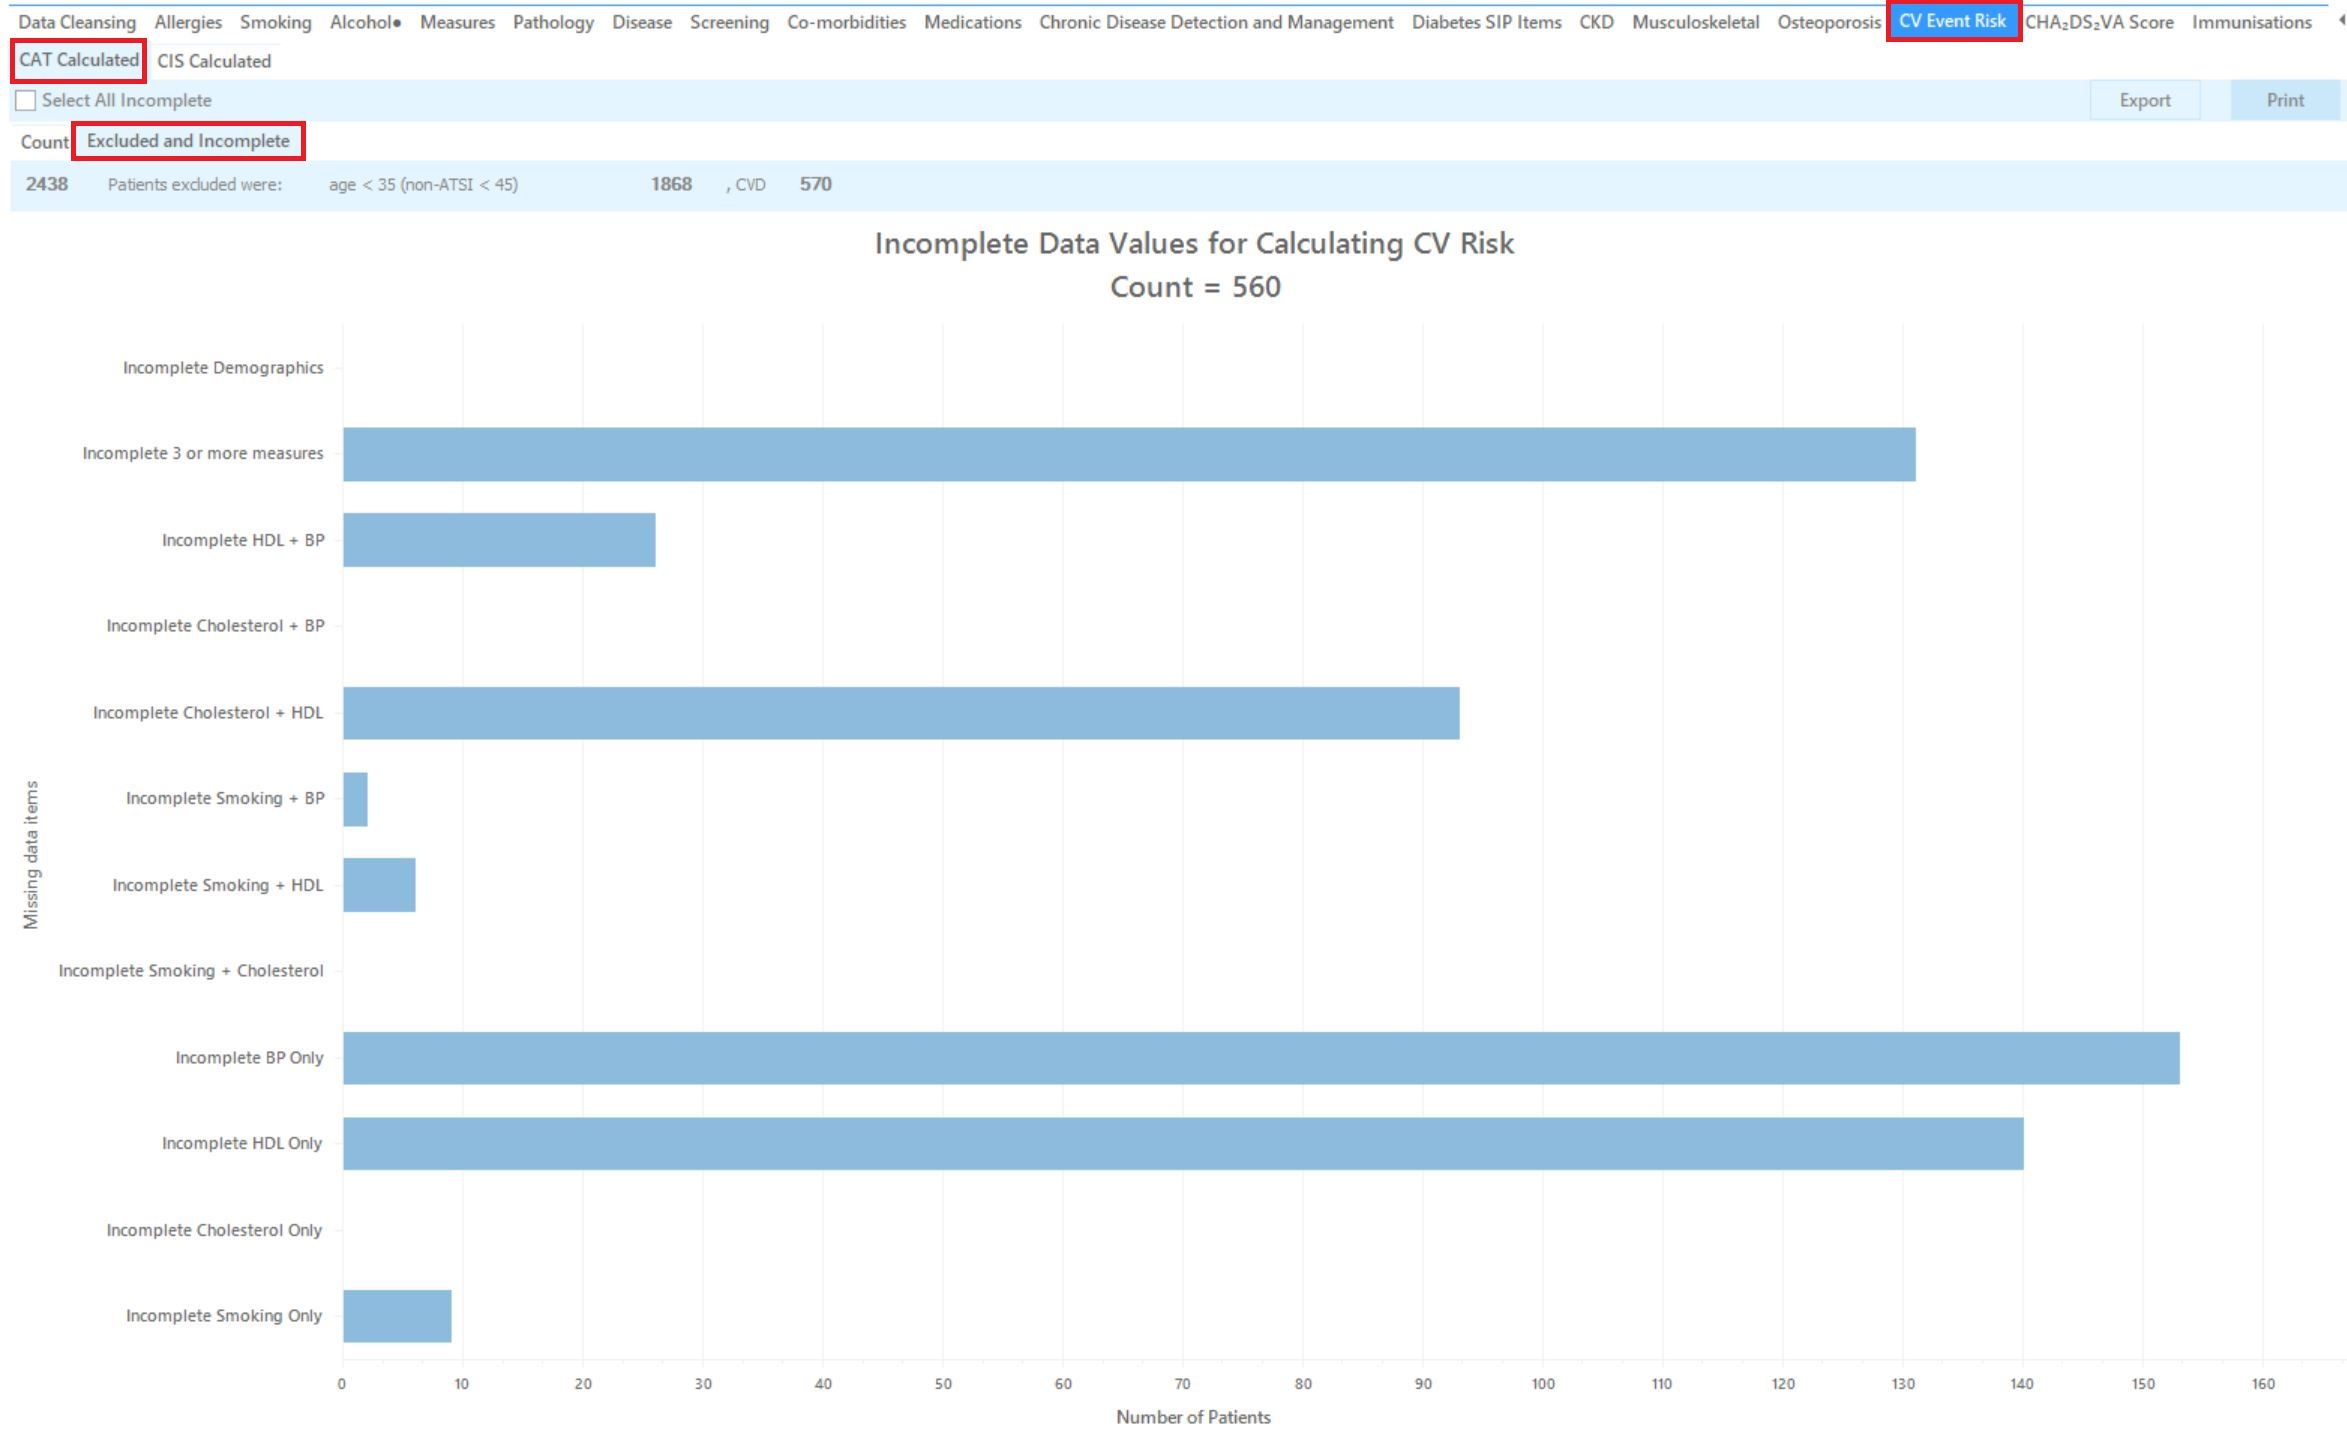
In this example there are 154 patients with a diagnosed condition who were excluded (2002-154= 1848) and 549 were excluded due to missing data items as listed in the graph. This graph makes it easy to measure change as part of a QI activity. Patients can be easily identify by clicking on the graph and their records can be updated or a Topbar prompt can be created for the missing data items.
...
To Export Patient List to Microsoft Excel:
1. Click on the “Export Icon” Icon” at the top of the Patient Reidentification window.
2. Click on “Excel”
3. Choose a file name and a location to save to (eg. Create a folder C:/ClinicalAudit/CAT Patient FollowUp)
4. Click “Save”
The steps above will produce a list of patients with contact details in MS Excel which can then be used to:
...