Page History
Demographics displays your entire data set as a breakdown of males/females and age group. The data is displayed as a bar chart showing the number of patients per age group.
Choosing to view demographics in months allows children to be targeted.
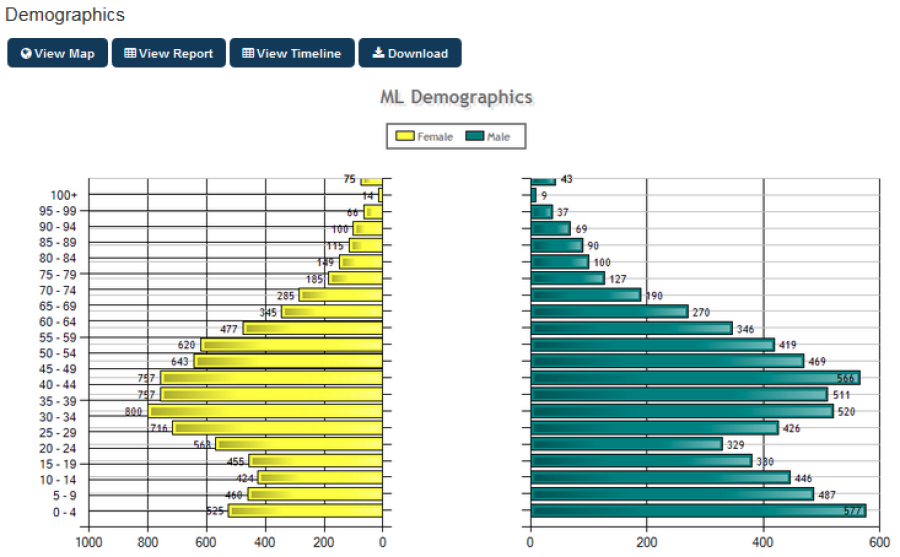
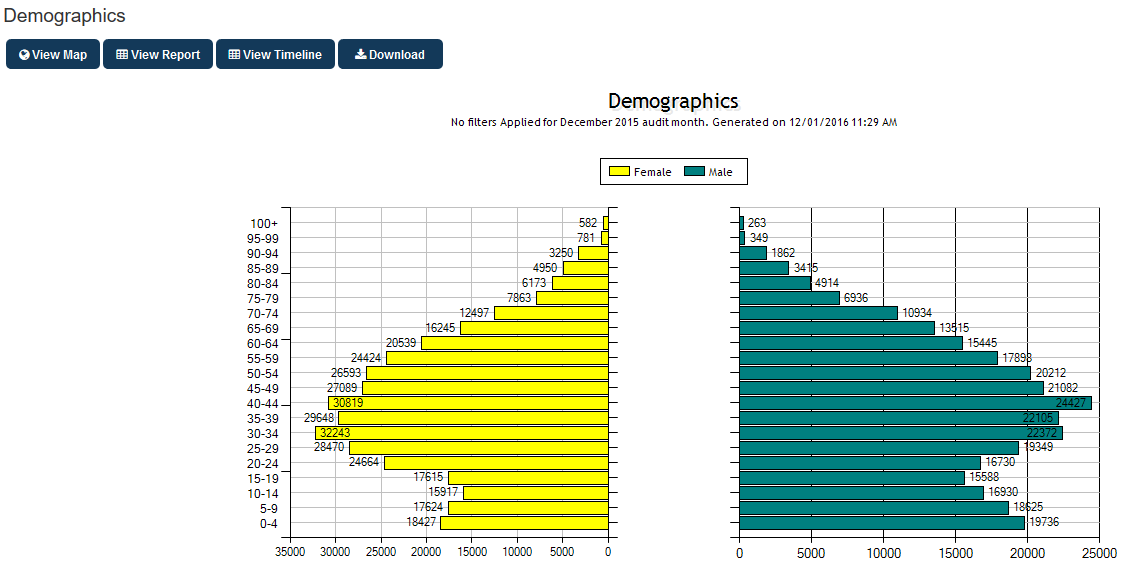
Figure 98: Demographics Chart