Page History
The Allergies report displays your data as a breakdown of allergy status: Allergy Recorded, No Known Allergies, Nothing Recorded. The data is displayed as a pie chart.
The percentage in each allergy status group is displayed for each segment of the pie chart.
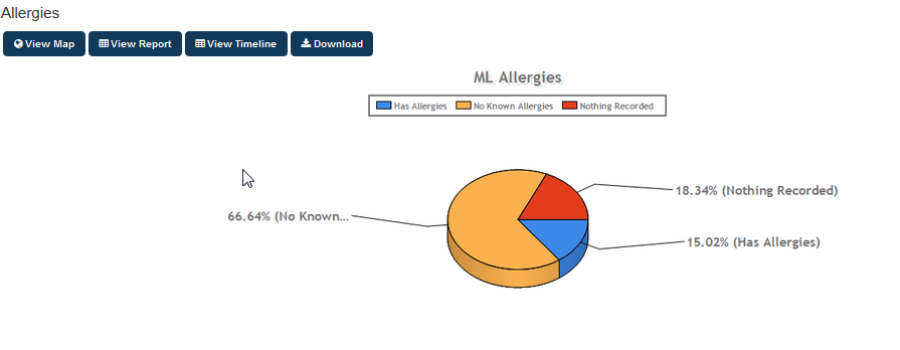
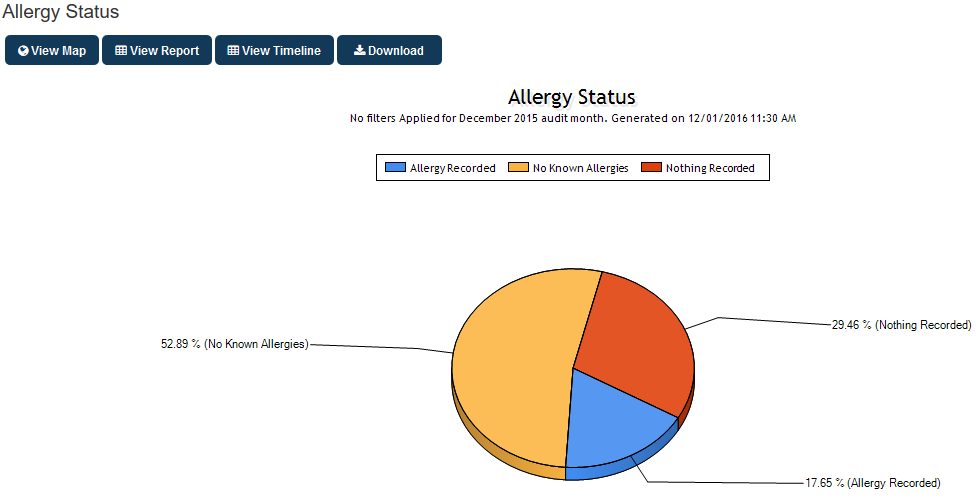
Figure 100: Allergies Chart