Page History
...
- BMI (Body Mass Index)
- Waist
- BP (Blood Pressure)
- Spirometry
- Physical Activity
Anchor
Measurements > BMI displays your data as a breakdown of BMI status: Morbid Obesity (40+),
Obese(30 to 40), Overweight(25 to 29.9), Healthy(18.5 to 24.9), Underweight(<18.5).
The data is displayed as
- Count per age range in a bar chart
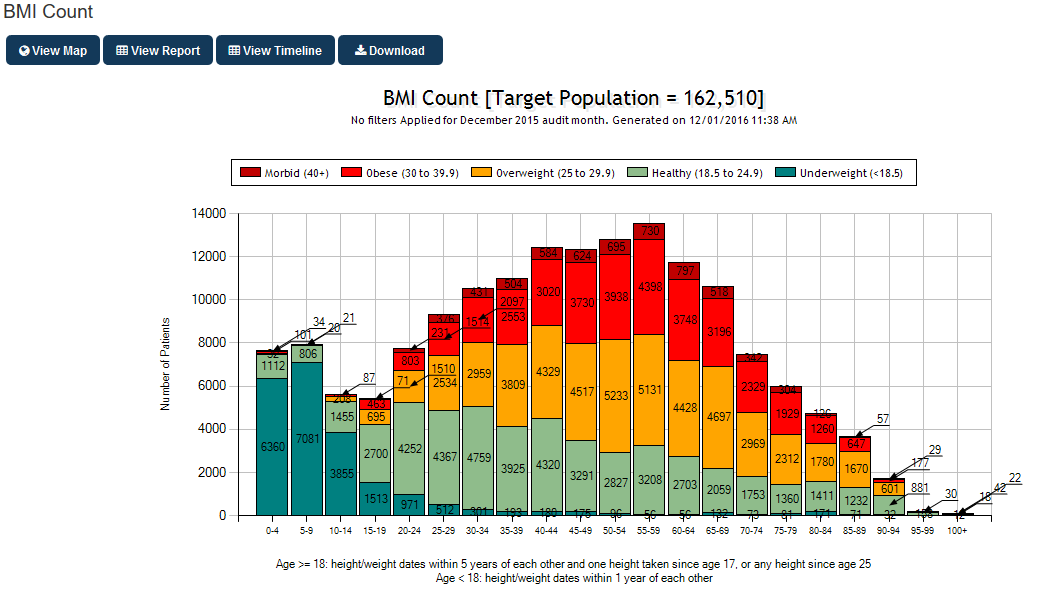
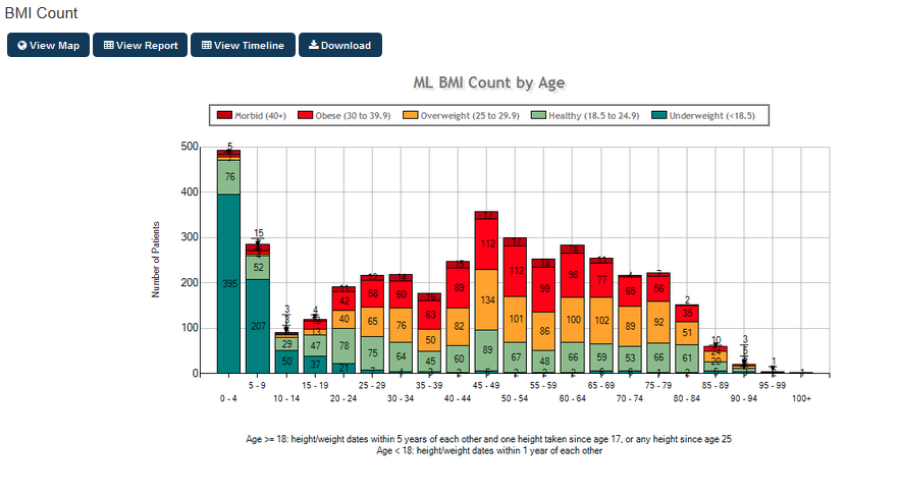
Figure 103: BMI ChartAnchor
Measurements > Waist displays your data as a breakdown of risk status. The risk ranges differ depending on whether you are measuring waist for risk of CVD or Diabetes. CAT provides 2 separate tabs:
- Waist > CVD Risk
- Waist > Diabetes Risk
Ranges are displayed in a pie chartcharts:
CVD Risk | Diabetes Risk |
Male <93<94, 94-102, >102, no waist recorded | Non ATSI Male < 102, 102-110, >110 |
and No Waist Recorded.
Anchor
BP (Blood Pressure)
Measurements > BP displays your data as a breakdown of BP status: <=130/80, 130/80-140/90, >140/90, Incomplete Data, No BP Recorded. The data is displayed as a pie chart.
NOTE: A patient's BP must have both systolic and diastolic values recorded on the same day to be valid. The most recent recording is used. If only one value is recorded this will be invalid and display in the 'No BP Recorded' category.
A patient's BP will be shown in the higher segment if either of the systolic or diastolic values is above the cut-off. For example a BP of 141/85 will end up in the >140/90 category.
Spirometry
Measurements > Spirometry displays your data as a breakdown of date last recorded: FEV1/FVC <0.7, FEV1/FVC >=0., Nothing Recorded. The data is displayed as a pie chart.
For all Measurements Reports, clicking on View Report will open a sub-set of the Benchmark Report to show data specific to BMI, Waist, BP or Spirometry.
Clicking on View Map will allow for measurements information to be mapped, functions are the same as described for View Map Function (Section 9)
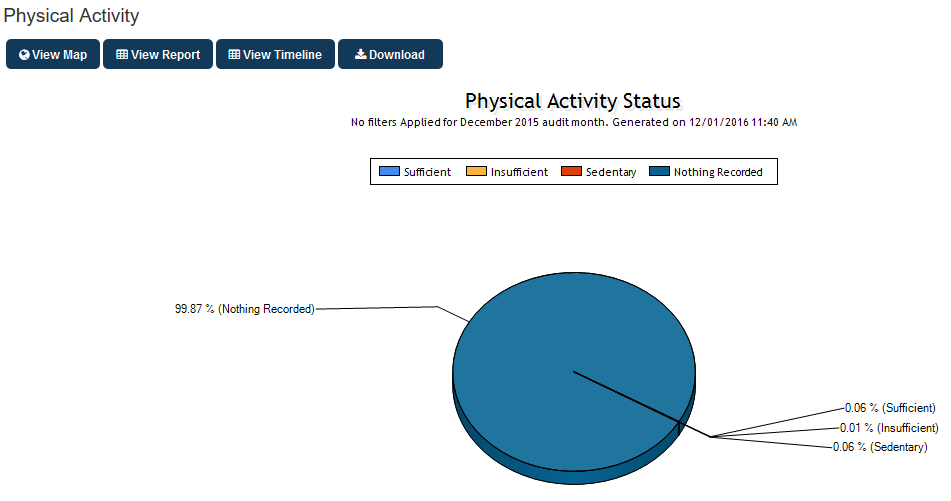
Physical Activity
Measurements > Physical Activity displays information in regards to the physical activity status of the patients in a pie chart. The data is broken down into Sufficient (activity), insufficient, Sedentary and Nothing Recorded. 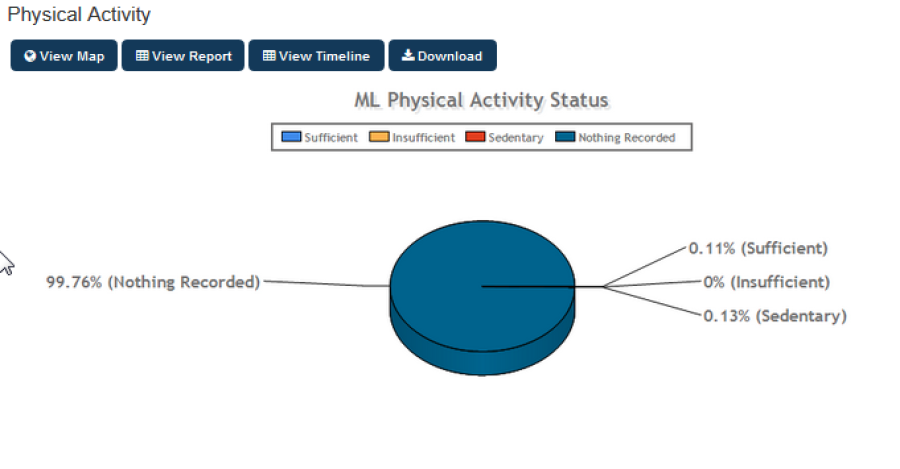
Figure 104: Physical Activity Chart