Page History
...
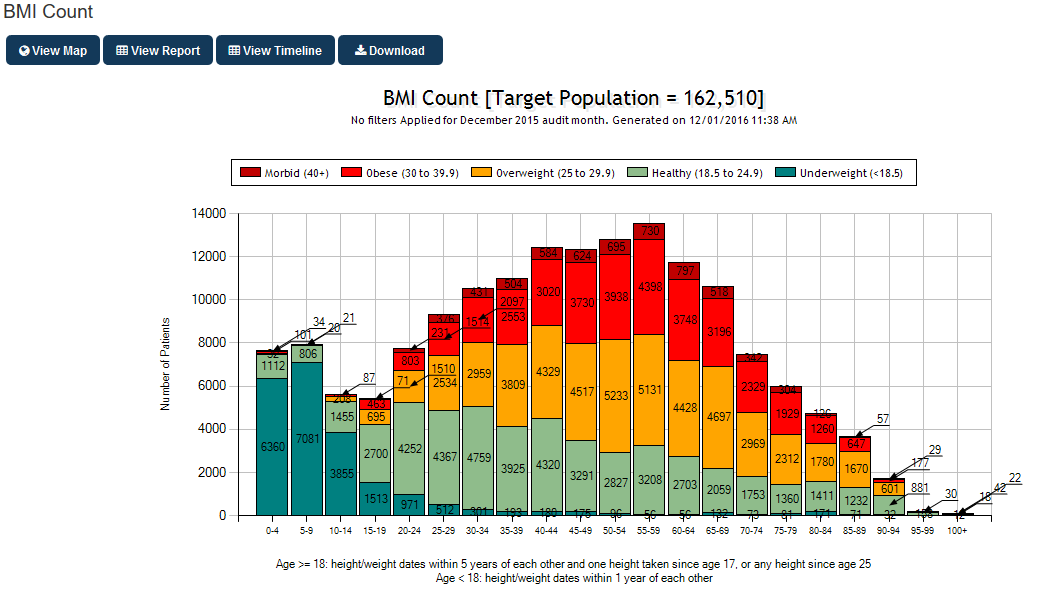
- Count per age range in a bar chart
...
Waist
Measurements > Waist displays your data as a breakdown of risk status. The risk ranges differ depending on whether you are measuring waist for risk of CVD or Diabetes. CAT provides 2 separate tabs:
- Waist > CVD Risk
- Waist > Diabetes Risk
Ranges are displayed in a pie chartcharts:
CVD Risk | Diabetes Risk |
Male <93<94, 94-102, >102, no waist recorded | Non ATSI Male < 102, 102-110, >110 |
...
Physical Activity
Measurements > Physical Activity displays information in regards to the physical activity status of the patients in a pie chart. The data is broken down into Sufficient (activity), insufficient, Sedentary and Nothing Recorded.
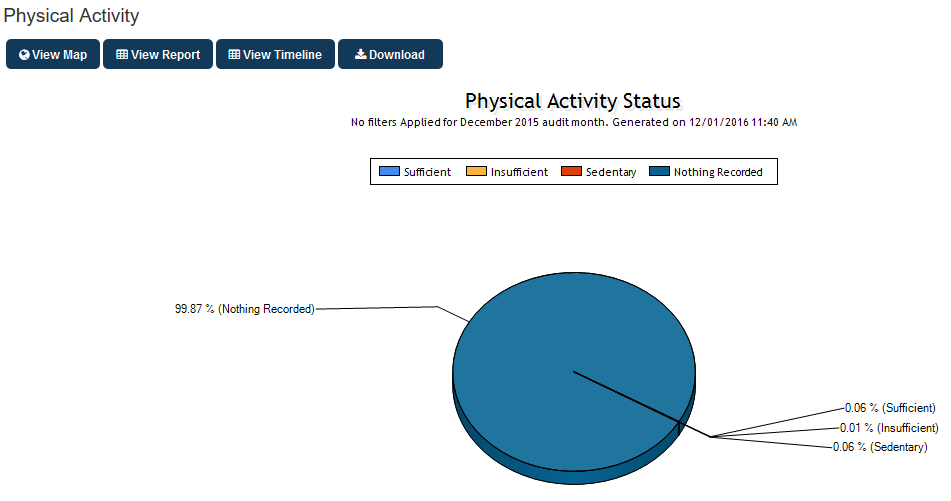
Figure 104: Physical Activity Chart