Page History
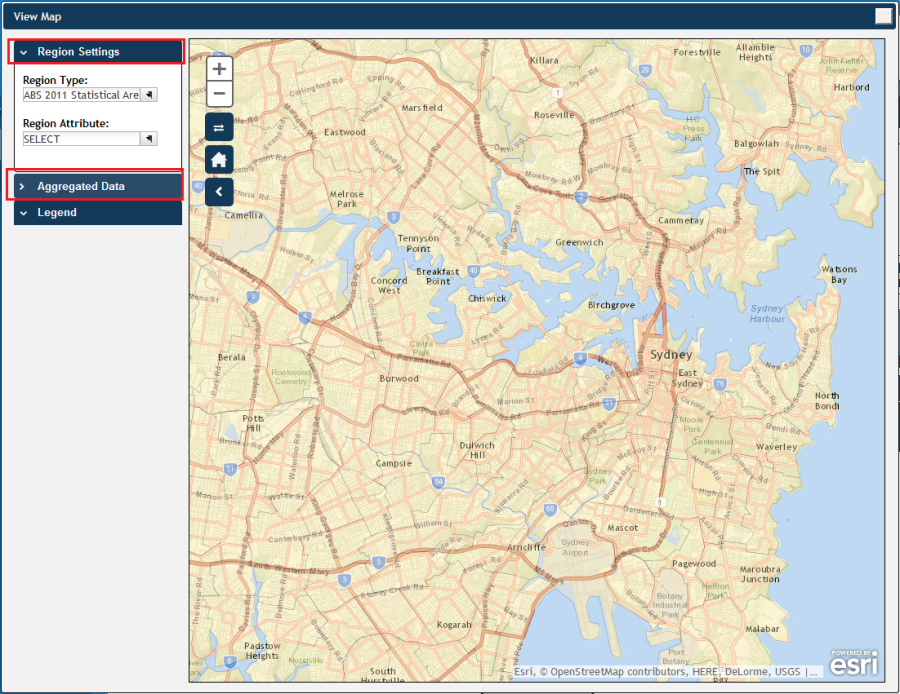
View Map is a feature that allows the user to overlay PAT CAT aggregated data and Australian Bureau of Statistics (ABS) data, on a geographical map using a variety of pre-set geographical boundaries. This module will open in a new window which can be resized by using your mouse.
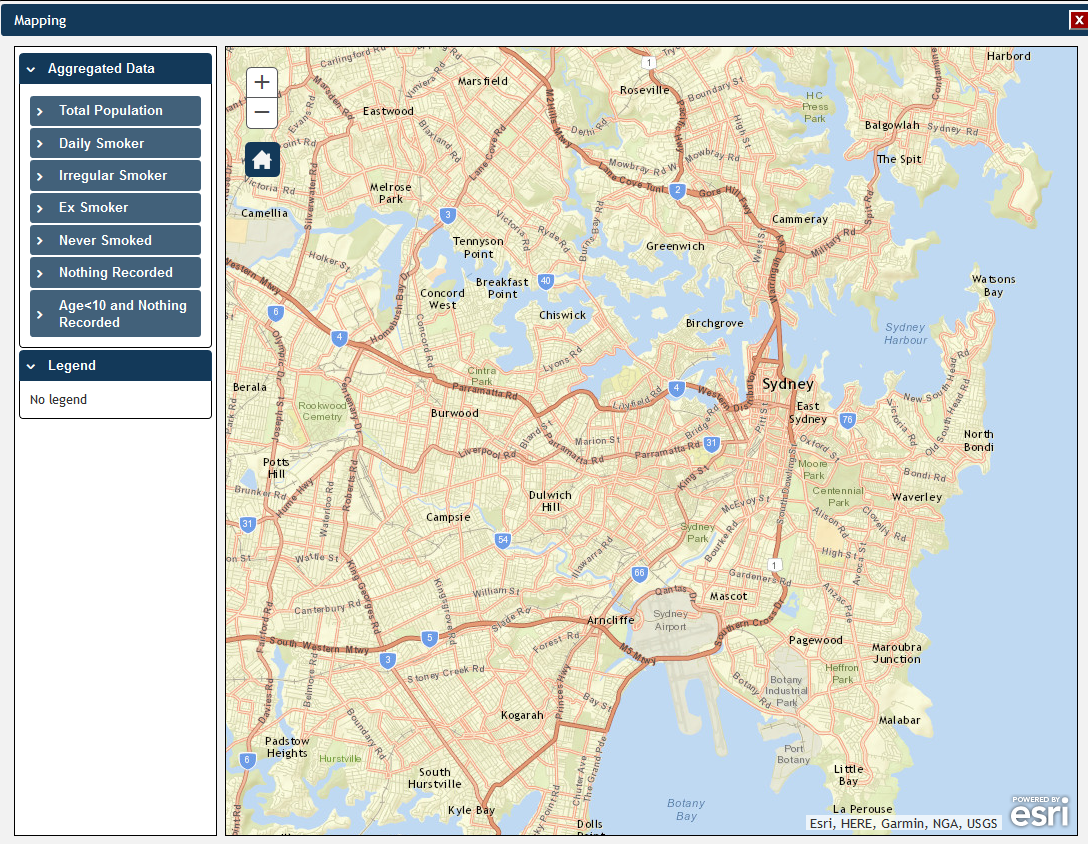
The left section of the View Map window contains a number of drop down boxes allowing you to select the Region Type, Region Attribute in the upper half and the Aggregated Data in the lower halfAggregated Data.
| Warning |
|---|
Loading map data is done 'on the fly' as you open the map window - this is due to the privacy measures in place in PAT CAT which prevent location data to be stored in the same place as clinical data. Please be patient as with large patient populations it can take up to 5 minutes to load all data for a report. |
The 'View Map' button is available on all report tabs and when clicked initially shows a map of your area without any overlayed information. You can add statistical data and/or selected aggregated data by using the options under the respective headingsindicators of interest by using the tick boxes.
The next chapters explain how to select data to be displayed on the map and how to use the statistical and aggregated dataaggregated data.
| Warning |
|---|
Please note that the Australian Bureau of Statistics has updated their SA2 (full definition here) areas after the 2016 census. PAT CAT mapping will be updated to the new mapping as detailed here - currently planned over the 2017 Christmas period. |
| Children Display |
|---|