Page History
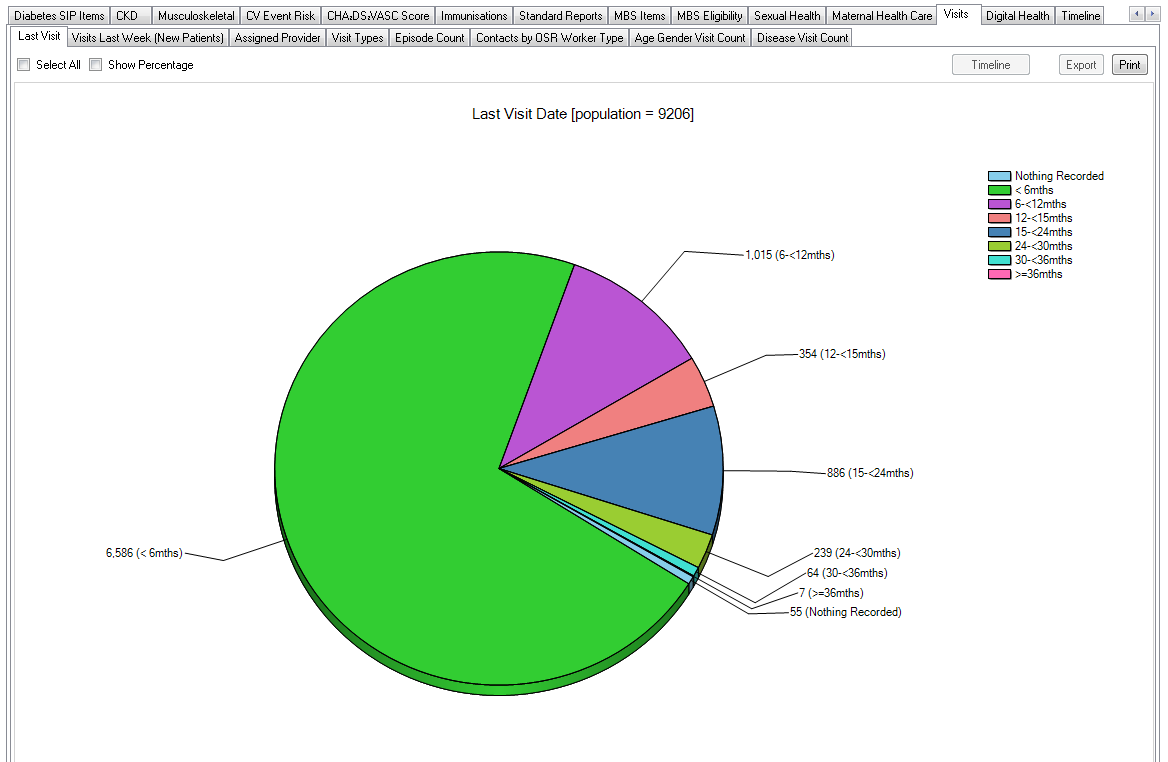
This report shows a pie chart for patients by the date of last visit. The graph segments are in line with the last visit filter.
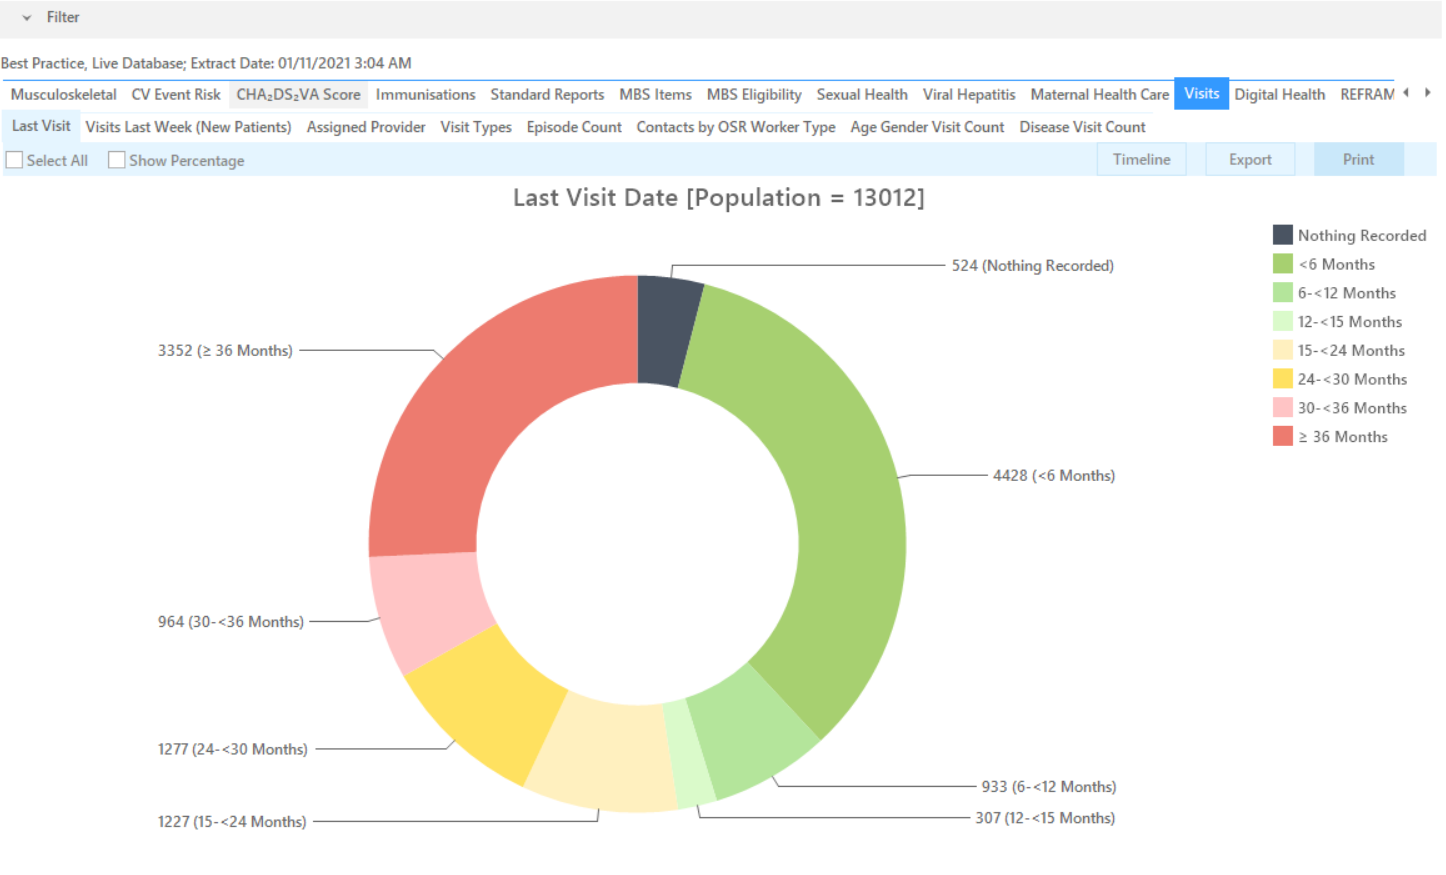
This report shows a pie chart for patients by the date of last visit. The graph segments are in line with the last visit filter.