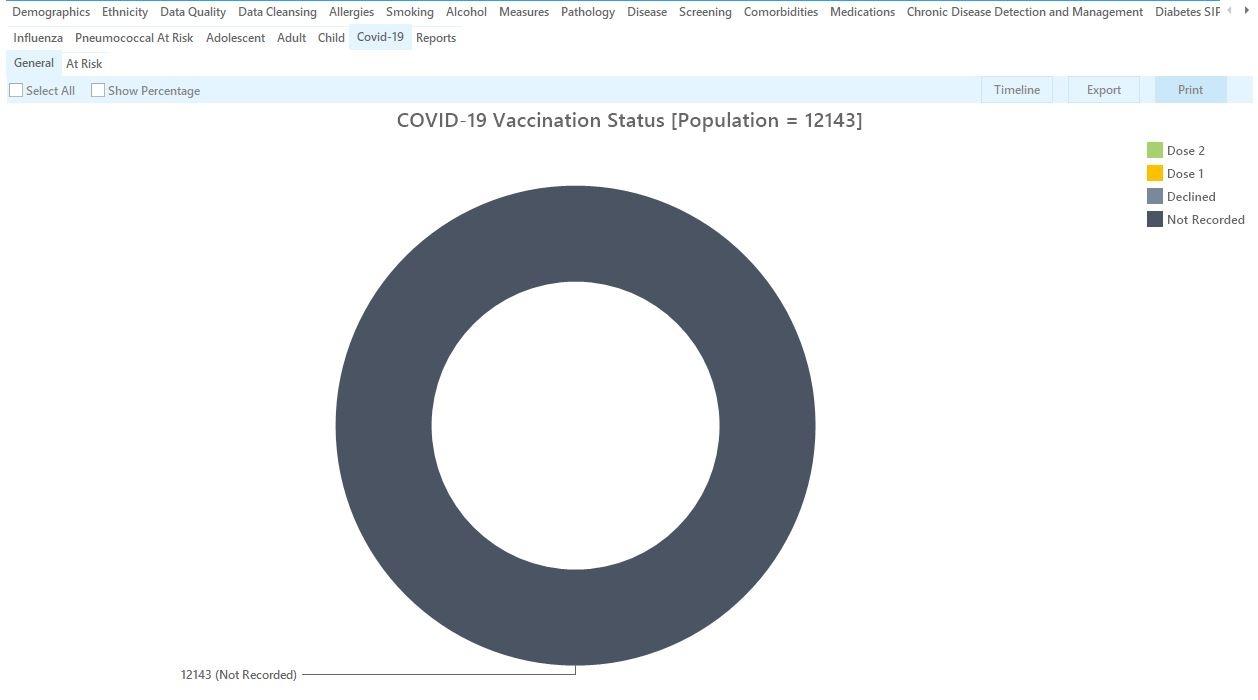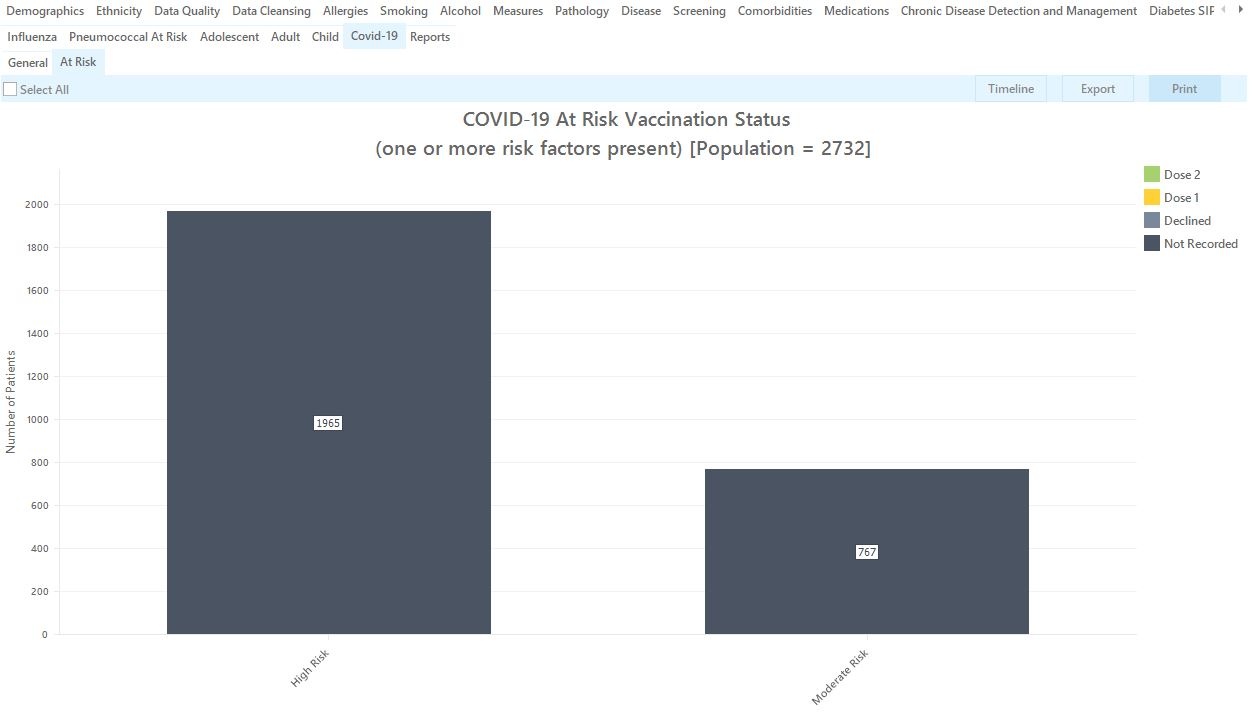
The COVID-19 vaccination report has two tabs, one showing the general population and the other one the at risk population at your practice.
In the 'General' tab all patients are shown in a doughnut chart with the following disaggregation:
Dose 2 received - second dose received
Dose 1 received - first dose received
Declined - currently only available in Medical Director
Not Recorded - no vaccination recorded

The 'At Risk' tab shows a bar chart with high risk and moderate risk patients. The risk is based on the following criteria as defined by the Department of Health:
While we have mapped a very large number of conditions to identify all at risk patients, due to time constraints and inconsistencies between the different clinical systems, some conditions were not included. These are:
Please exercise your discretion as clinicians to ensure that all patients who are at risk are included in the vaccine allocation, as Pen CS can only provide a report that shows potentially at risk patients to the best of our ability. |
Who is at high risk of severe illness
Who is at moderate risk of severe illness
n the 'At Risk' tab all patients are shown in a bar chart with the following disaggregation:
Each bar has further information about the patients showing:
