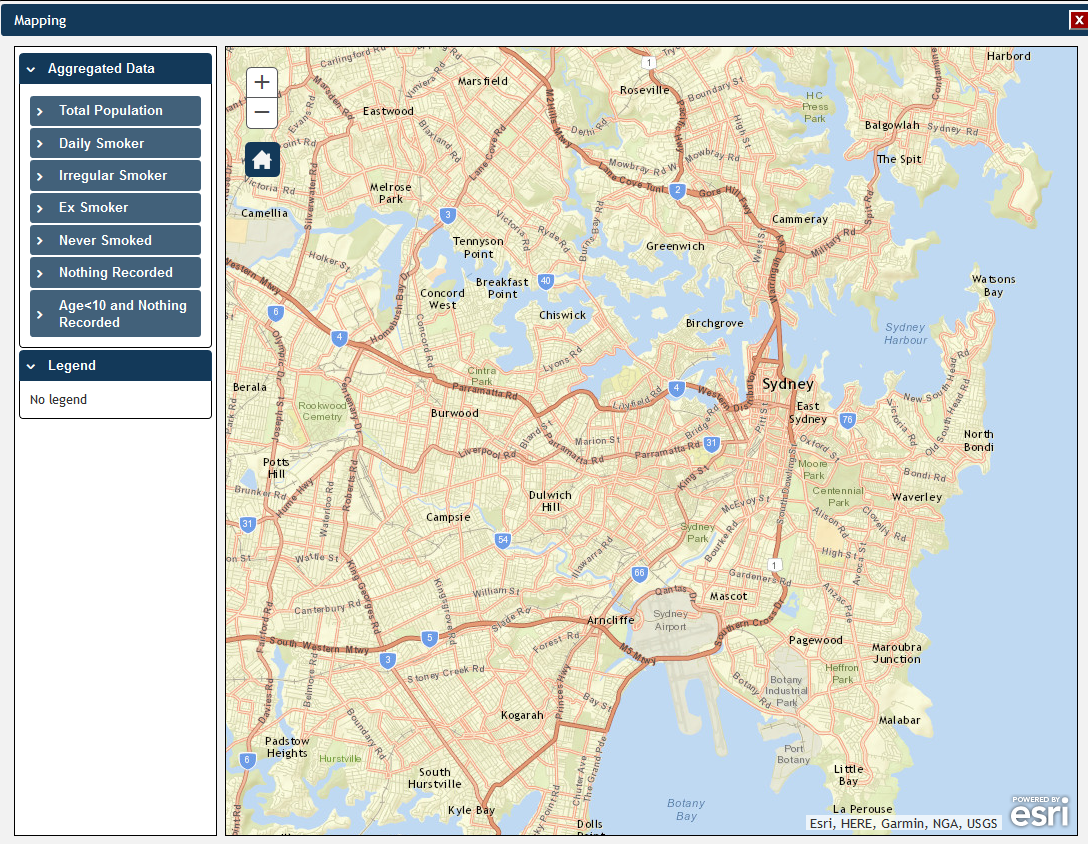
View Map is a feature that allows the user to overlay PAT CAT aggregated data on a geographical map using a variety of pre-set geographical boundaries. This module will open in a new window which can be resized by using your mouse.
The left section of the View Map window contains a number of drop down boxes allowing you to select the Aggregated Data.
The 'View Map' button is available on all report tabs and when clicked initially shows a map of your area without any overlayed information. You can add selected aggregated data by using the indicators of interest by using the tick boxes.
The next chapters explain how to select data to be displayed on the map and how to use the aggregated data.