Practice users have access to PAT CAT using their CAT Plus logon. If your PHN has issued you with a licence you can log on to CAT4, Topbar and PAT CAT using the same user name and password. PAT CAT has many useful reports for practice users, with details provided in the links below.
You will not be able to see other individual practice data, only aggregate data for the whole catchment. PAT CAT has a very useful timeline option to enable a practice to analyse their data over time. Unlike CAT4, PAT CAT can provide filtered timelines, so for example you can follow the blood pressure measurements of your patients with coronary heart disease over time and see if their BP has come down. Please check the timeline pages linked below for full details.
To use PAT CAT, follow the steps below.
Step-by-step guide
- Log on to PAT CAT using your CAT Plus credentials. If unsure about the URL please contact your PHN for details.
- Once logged on you will see a user interface similar to CAT4 with filters and reports. Please note that not all CAT4 reports are available in PAT CAT yet.
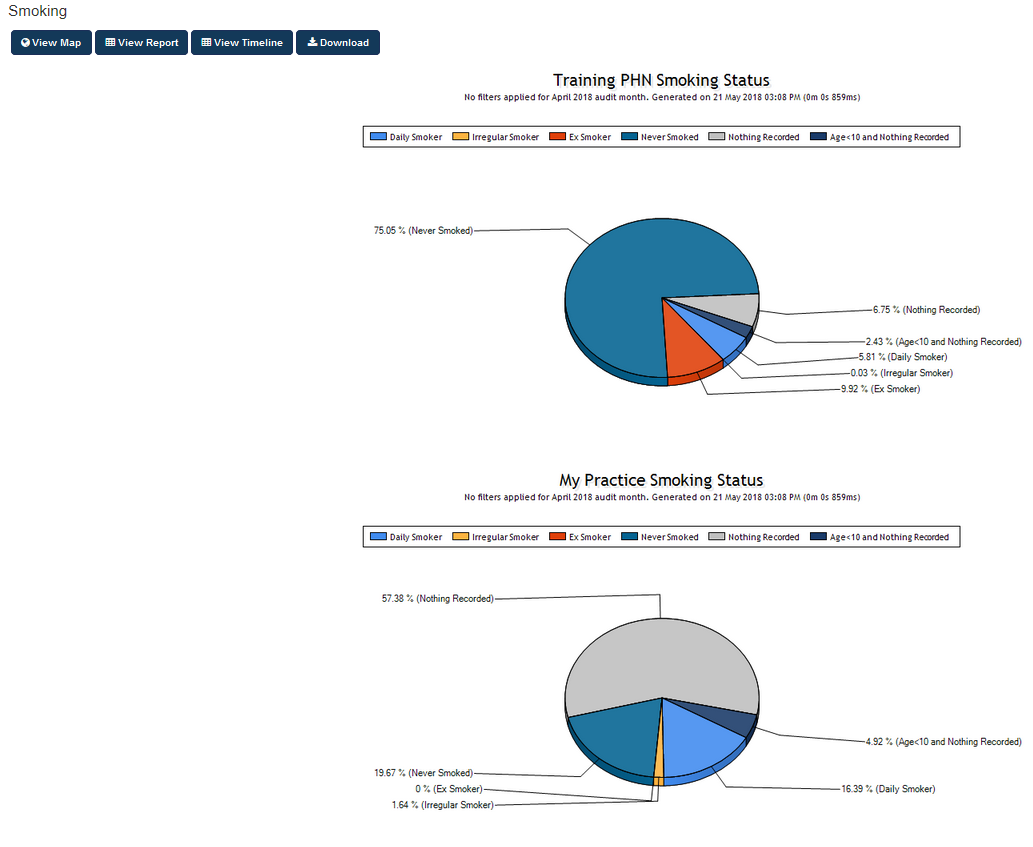
- All graphs will display for your practice and for the whole PHN catchment, like in this example of the 'Smoking' graph:
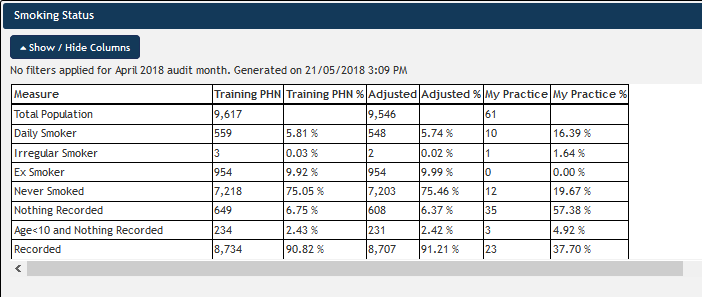
When you use the 'View Report' option you will see the details/the number behind the graph:
Related articles
Asides from the displaying two graphs instead of one and some filtering options, all functionality shown in the pages below is available to all PAT CAT users. Please see for more information: