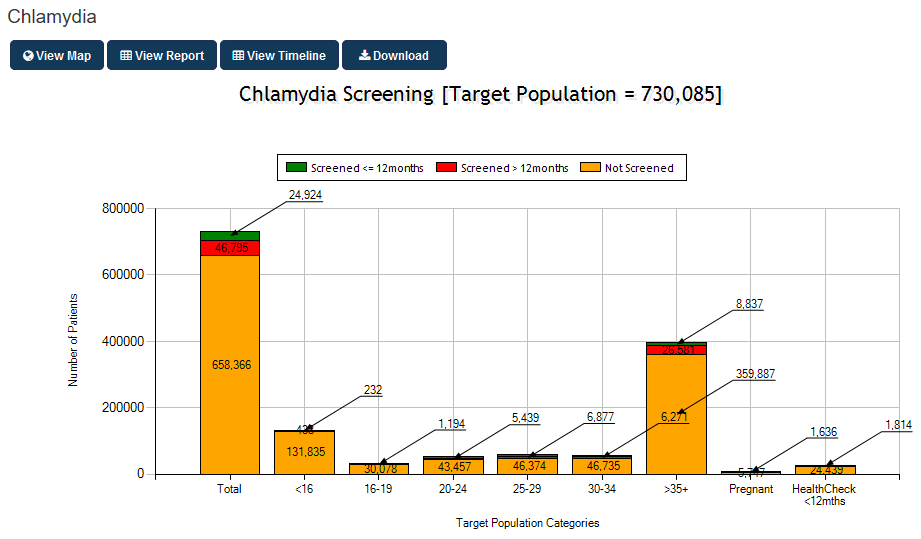
Chlamydia, Gonorrhoea, Trichomoniasis
The Screening graphs for Chlamydia, Gonorrhoea and Trichomoniasis display the % patients screened. It can be filtered using the standard filters in CAT4 to display the target population of interest and will show a breakdown by age groups. Practices without relevant data are listed below the graph and are excluded from the report.
Each graph provides a breakdown by
- Age ranges
- Screened in the last 12 months
- Screened more than 12 months ago
- Pregnant
- Patients with a Health Check in the last 12 months
Example graph for Chlamydia below:
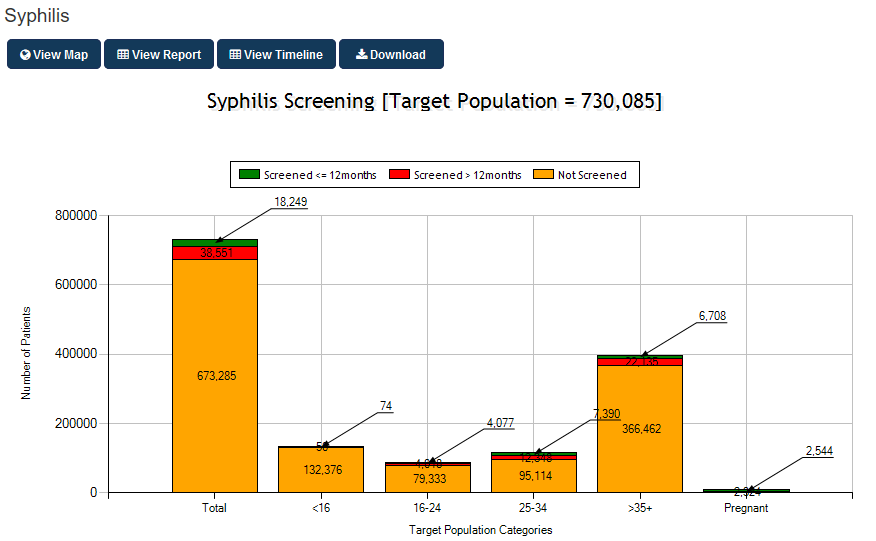
Syphilis, HepB, HepC and HIV
The Screening graphs for Syphilis, HepB, HepC and HIV display the % patients screened. It can be filtered using the standard filters in CAT4 to display the target population of interest and will show a breakdown by age groups.
Each graph provides a breakdown by
- Age ranges
- Screened in the last 12 months
- Screened more than 12 months ago
- Positive STI screening > [this BBV/STI only] follow up
- where there is a positive test for chlamydia/gonorrhoea/trich, the number of patients then screened for this BBV/STI
- Pregnant
Example graph for Syphilis below: