The adjusted column was designed to avoid counting patients that have visited multiple clinics in a PHN catchment more than once. The number in the 'Adjusted' column is based on a 'virtual' patient to provide complete data without counting patients more than once. Patients who have visited more than one clinic in an organisation's catchment will be counted more than once in the organisation column (PHN or other) as their data is included in each upload from the individual clinics.
The 'Adjusted' column will use the most recent visit on record as a starting point for the virtual patient and remove all other instances of patients with more than one visit. Then PAT CAT will find missing/incomplete fields for the patient in the data uploaded from other clinics and attempt to complete the virtual record.
For example if you have a patient who visited 3 clinics who all uploaded their data to PAT CAT and only one of the three clinics has a diagnosis of diabetes on file, PAT CAT will use the patient record with the most recent visit date. PAT CAT will then go through all reported indicators and check if there are results missing from the most recent record. Anything missing from the original record will be completed using data from the other visits of the patient. If there is more than one result available, the most recent one is used.
This creates a single virtual patient with all available and most up to date information from all clinics visited in the current reporting period.
When used for the whole catchment (no Practice filters) this will normally show a lower number in the adjusted column as duplicates are removed. Based on current numbers this can be between 10 and 25% less patients as visiting more than one practice is very common.
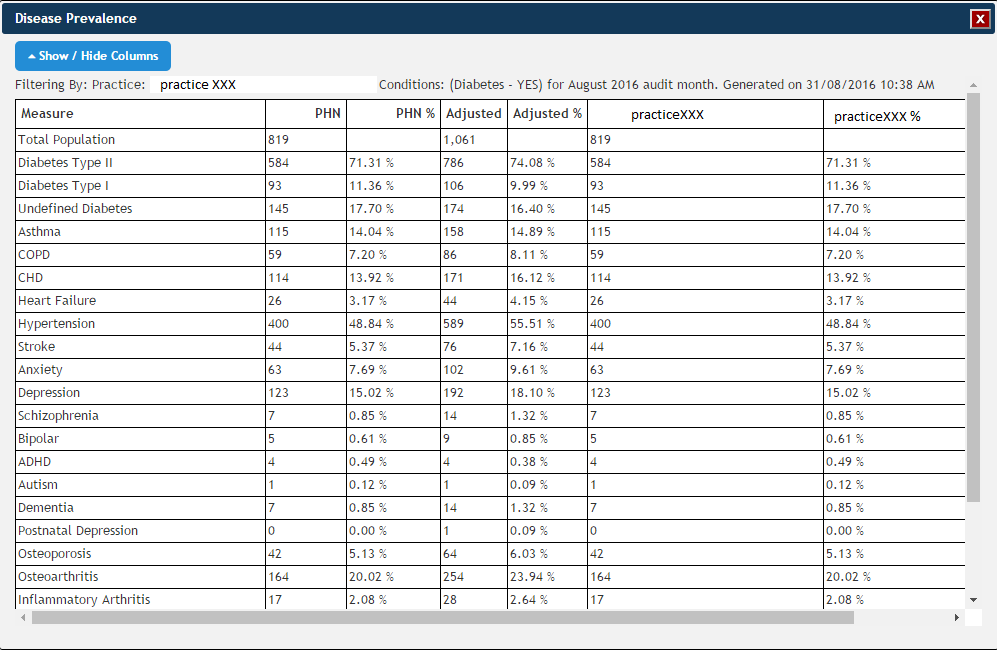
However when you use a filter for one practice (or a group of selected practices) the adjusted column can show higher numbers as in the example below. The filters applied were for one practice and for patients with diabetes only. As you can see from the total there are 819 patients at the clinic but 1061 in the adjusted column.
The adjusted column was not designed for this function but it can provide interesting data as it enables the PAT CAT user to see information about patient groups that has been entered at other clinics than the one filtered for. It does not provide information where the information was entered, but it might still be useful for some research.
Generally we recommend to use the adjusted data for report not filtering by practice(s), but as the above example shows, there can be valuable information gained from this report when filtering for one practice.