The cross tabulation report provides the ability to find patients who appear on more than one graph - this assists with the identification of target population risk groups.
For example: Highlight the graphs segment for BMI >30, Smoker, BP >140/90, Cholesterol level >7.5 and view which patients meet all these criteria.
As you highlight report chart segments you will see 2 pieces of information on the screen
- A ● will appear on the tab where you have made a chart segment selection
- A new line will appear underneath where the filter details display. This line will provide details of which chart segments are selected. The example below shows BMI (Obese, Morbid), Smoking (Daily), BP (>140/90). Lipids – Cholesterol (>7.5).
You will see that the 'Report' button has become active.
Figure 69: Multiple report selections for cross-tabulation
Click the 'Report' button
The standard Reidentification Report will display in an adjusted format to allow the data values for the chart selections you have made to be provided.
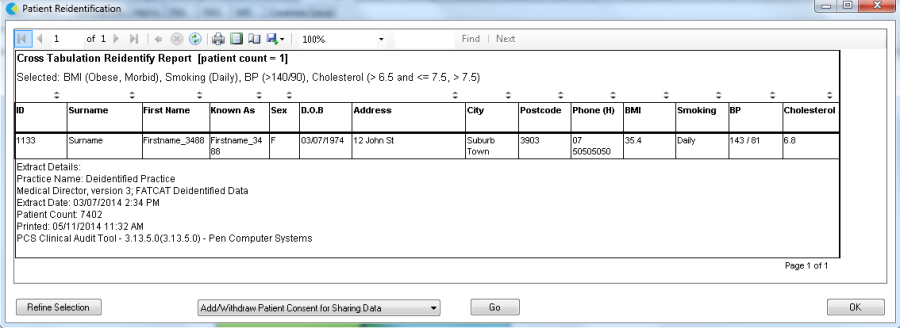
Figure 70: Cross Tabulation Report