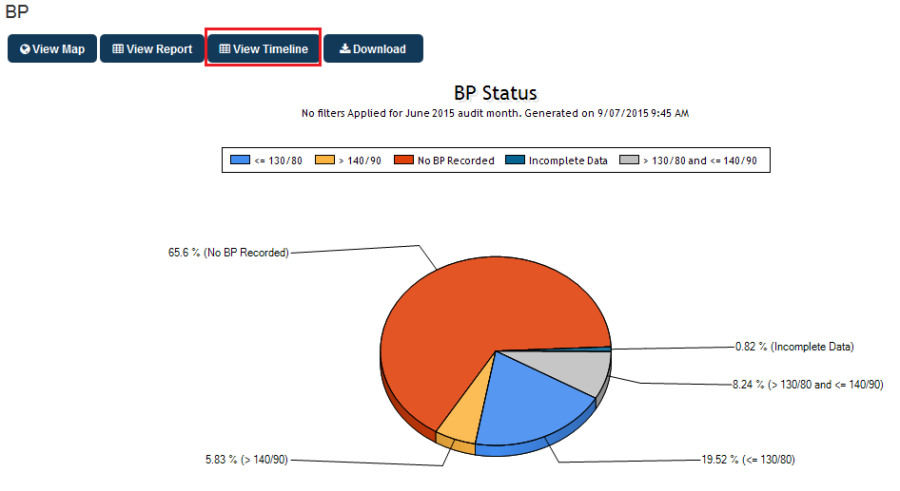
Each report has an option to view the Timeline – accessed through the button on the left:
Figure 149: View Timeline Button
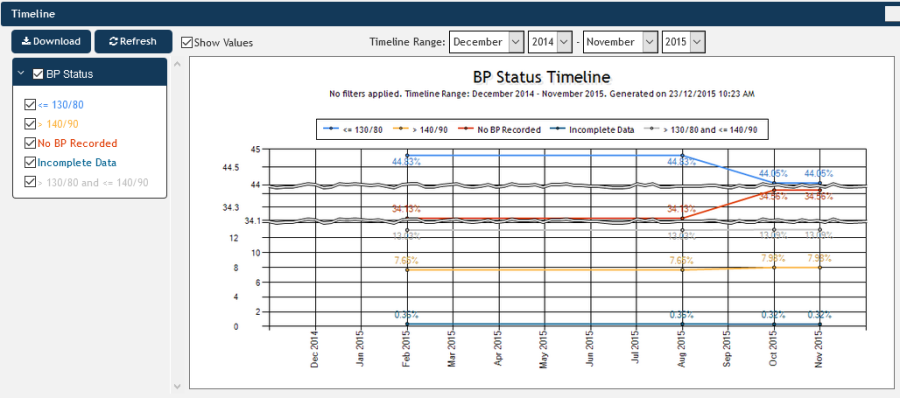
Clicking on this button will open a timeline report for the report currently open, in our example the blood pressure report. The data responds to all applied filters, so it is possible to filter for patients with particular conditions, visit dates or any other available filter option before viewing the timeline. The range of the timeline can be adjusted to reporting requirements using the dropdown boxes on top of the graph.
Figure 150: BP Timeline Report
The graph can be saved by using the "Download" button, this will create an image file of the graph which can be used in presentations or documents. It will be saved through your browser's download function.
Please note that our demo data does not provide a 'normal' timeline due to the different sizes of data for each month. Real data will be much more consistent but still dependent on the number of patients for each data point. To create meaningful timeline reports it might be required to apply a practice filter to remove a practice that has not uploaded data consistently.
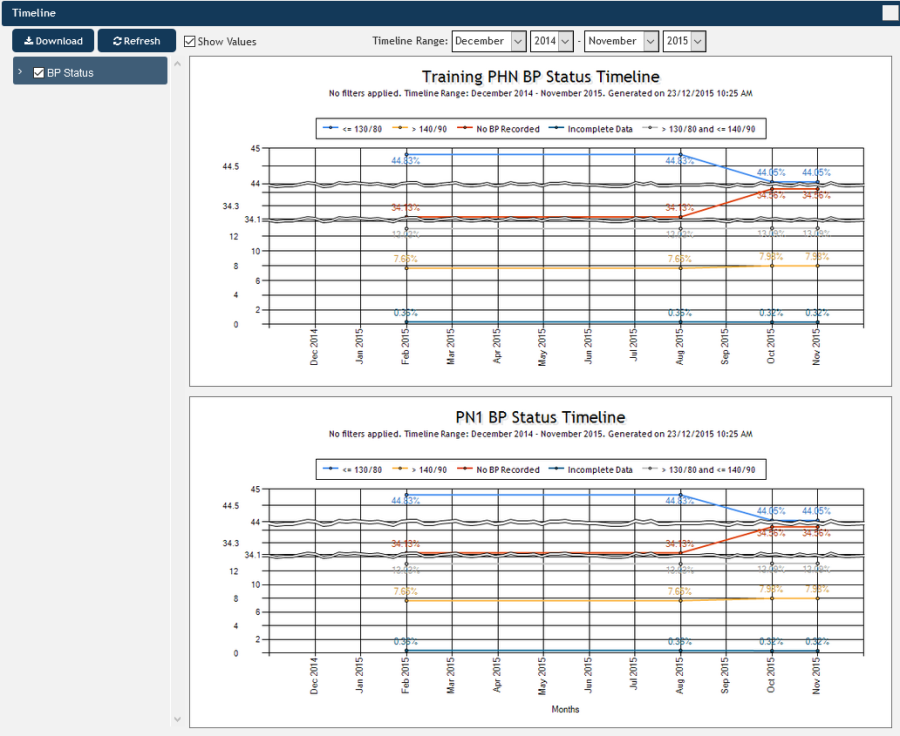
For practice users the same reports are available but will present both the PHN aggregated data and the practice data in two graphs. The "Download" button provides a choice of saving either the PHN or the practice data.
Figure 151: Practice User Timeline


