Page History
Once you have selected your data set snapshot and your data filters click 'Recalculate'. You will see the 'status bar' in the top right hand corner of the screen flashing while the filtered data is reloaded from the 'snapshot' into CAT4. Once this has finished you are ready to work with the data set of patients that match the selected conditions.
The data set for this exercise has 11795 7402 patients and has been filtered on Gender = Female and Condition = Asthma. 173 379 patients have been returned matching the filter.
Example:
Total Patients (7402), Filter (Female patients with Asthma) , Selected Patients (379)
Figure 37: Filtering a data set for analysis
...
This will display the Patient Reidentification Report with a list of patient details for the filtered population. Use the 'Export' menu option to export the data to Excel format for follow up, if required.
Note: The far right column on the Population list shows the patient's last visit date and assigned provider.
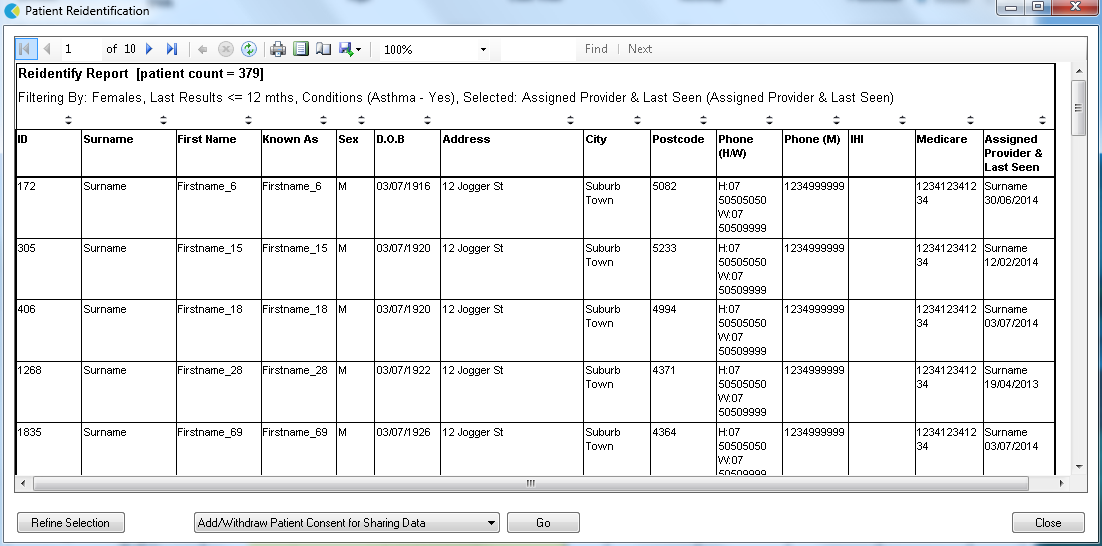
Figure 39: Patient Reidentification Report for filtered population