Page History
...
After loading your latest (or any other) data extract, you will be able to see the new PIP QI indicator set with the ten indicators as well as a summary report. Each report tab is pre-filtered to the specifications defined in the PIP QI and doesn't require any additional filtering. You can however apply additional filters if required.
| Warning |
|---|
| All details on the calculation and definitions are provided in the header/footer of the report graphs. |
To create a JSON file to upload PIP QI aggregated data to your PHN, follow the steps in this guide: Create a PIP QI Aggregate Report from CAT4 in JSON Format
Here are the details of the reports available:
- PIP QI report - summary of all indicators in aggregate format
|
|
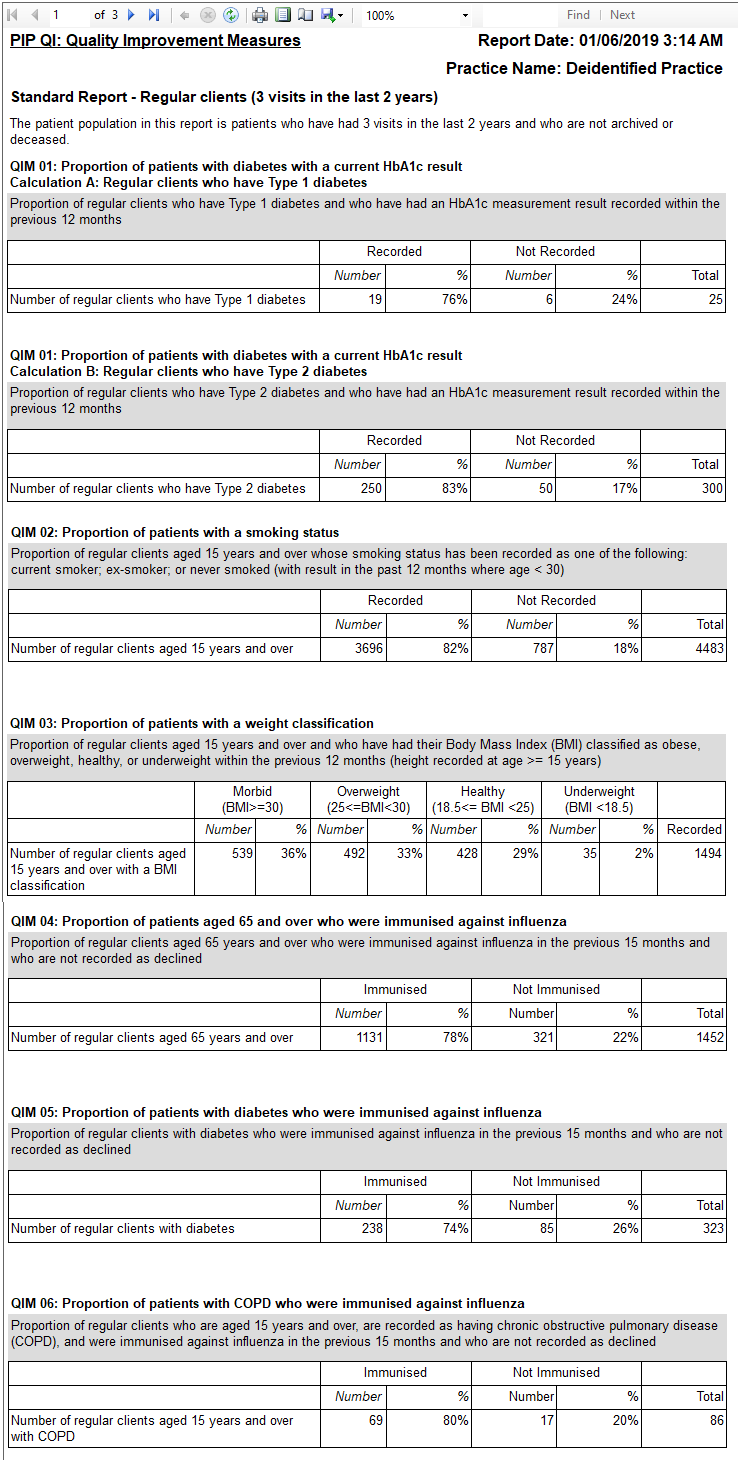
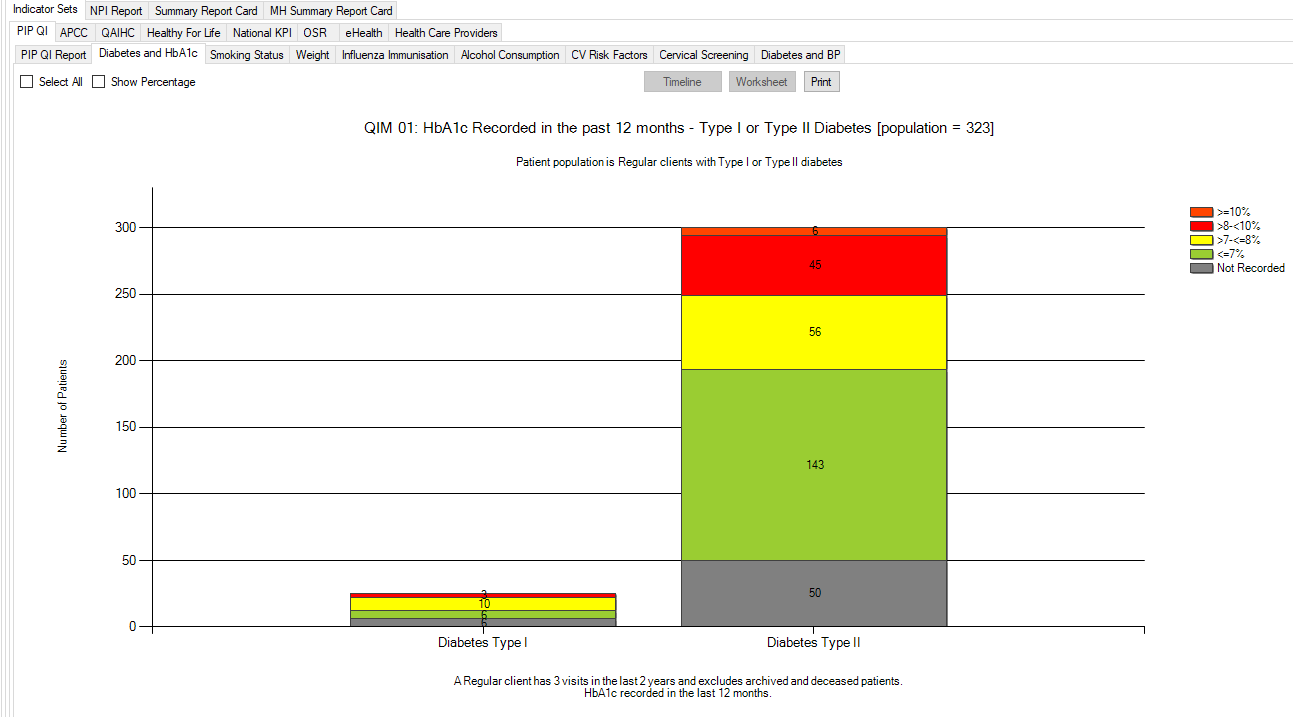
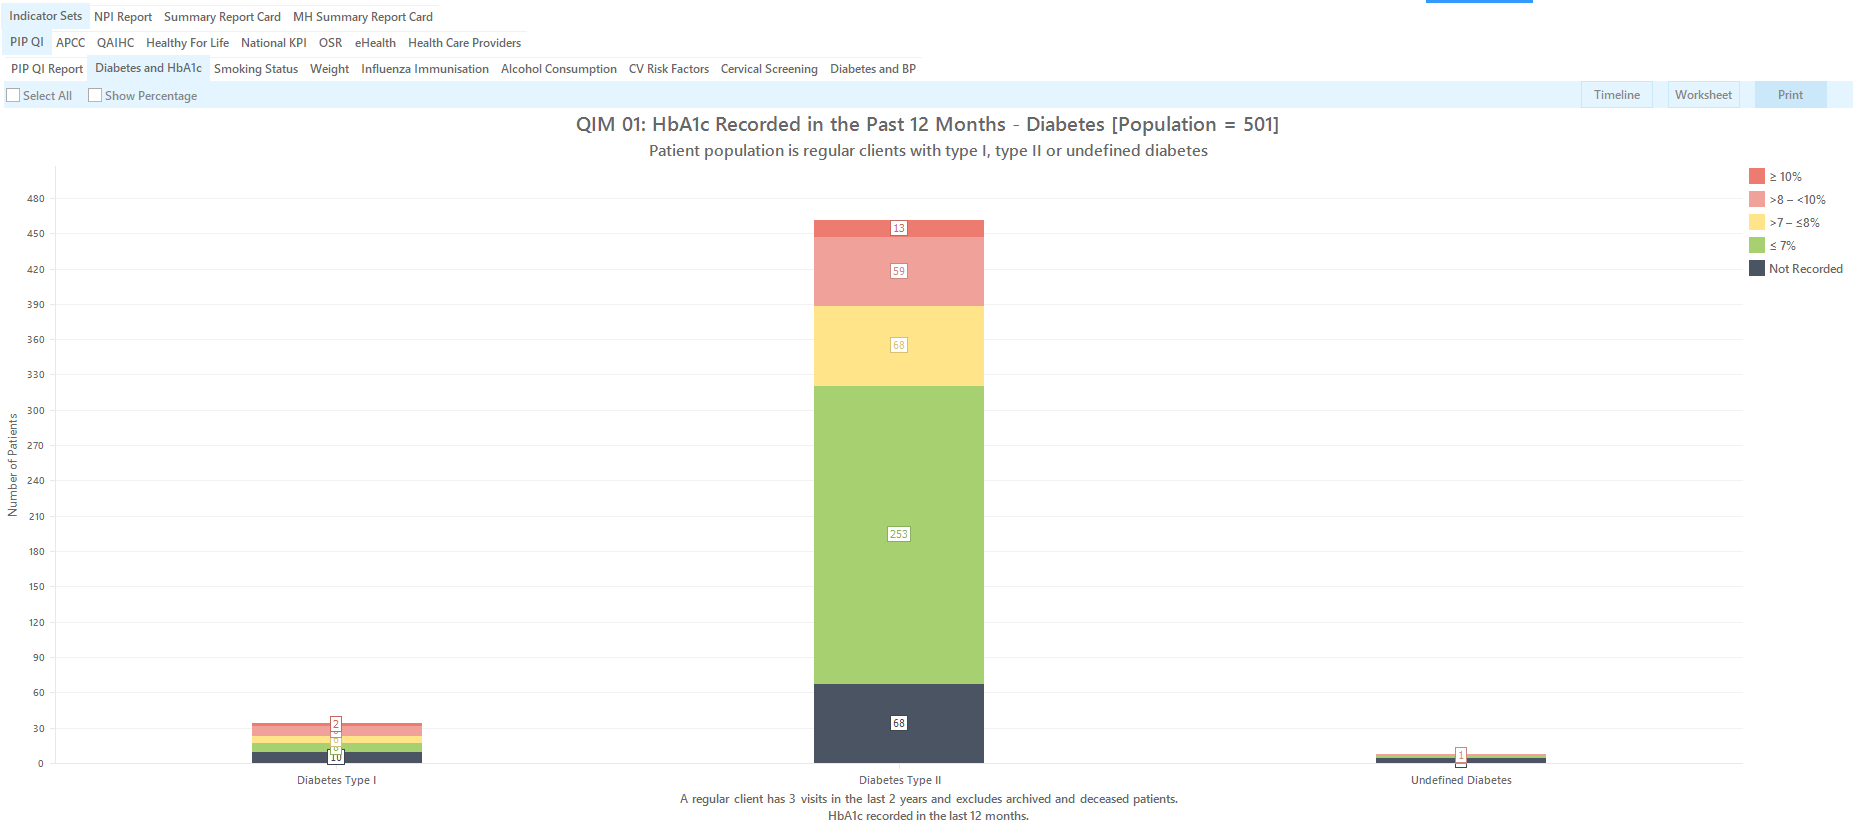
QIM01: Diabetes and HbA1c - regular patients with diabetes type 1 or type 2 and their HbA1c results in the last 12 months.
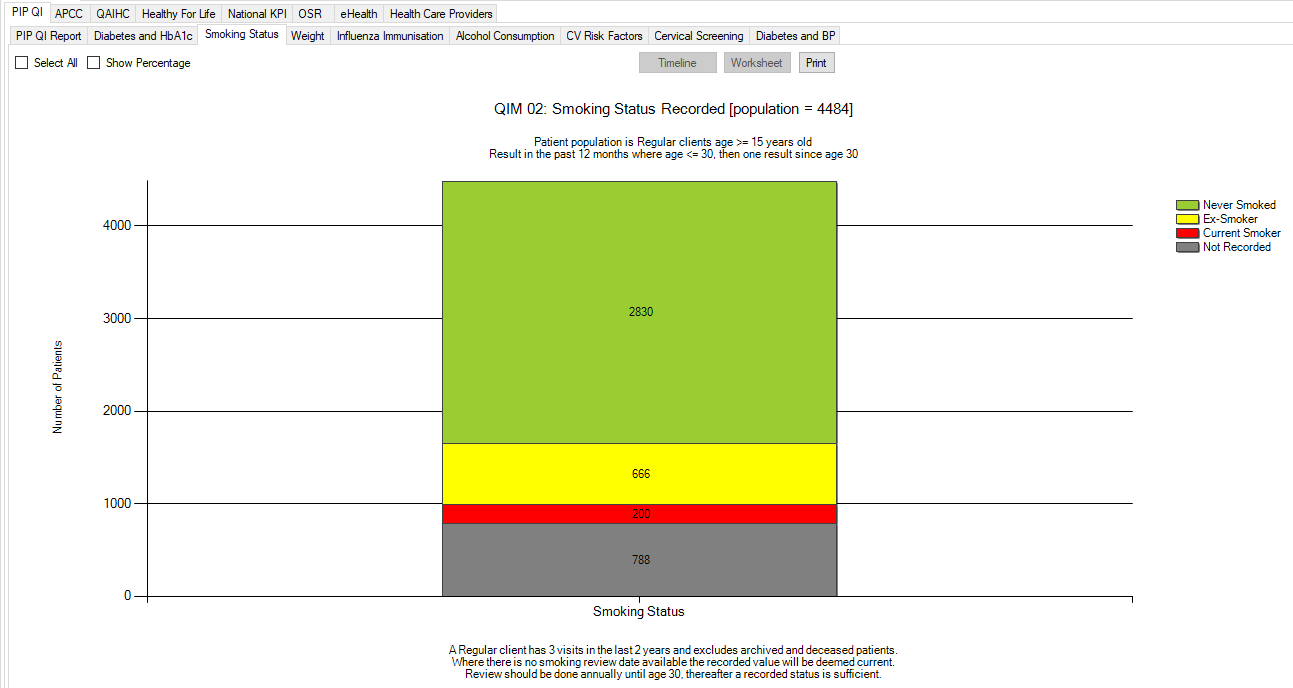
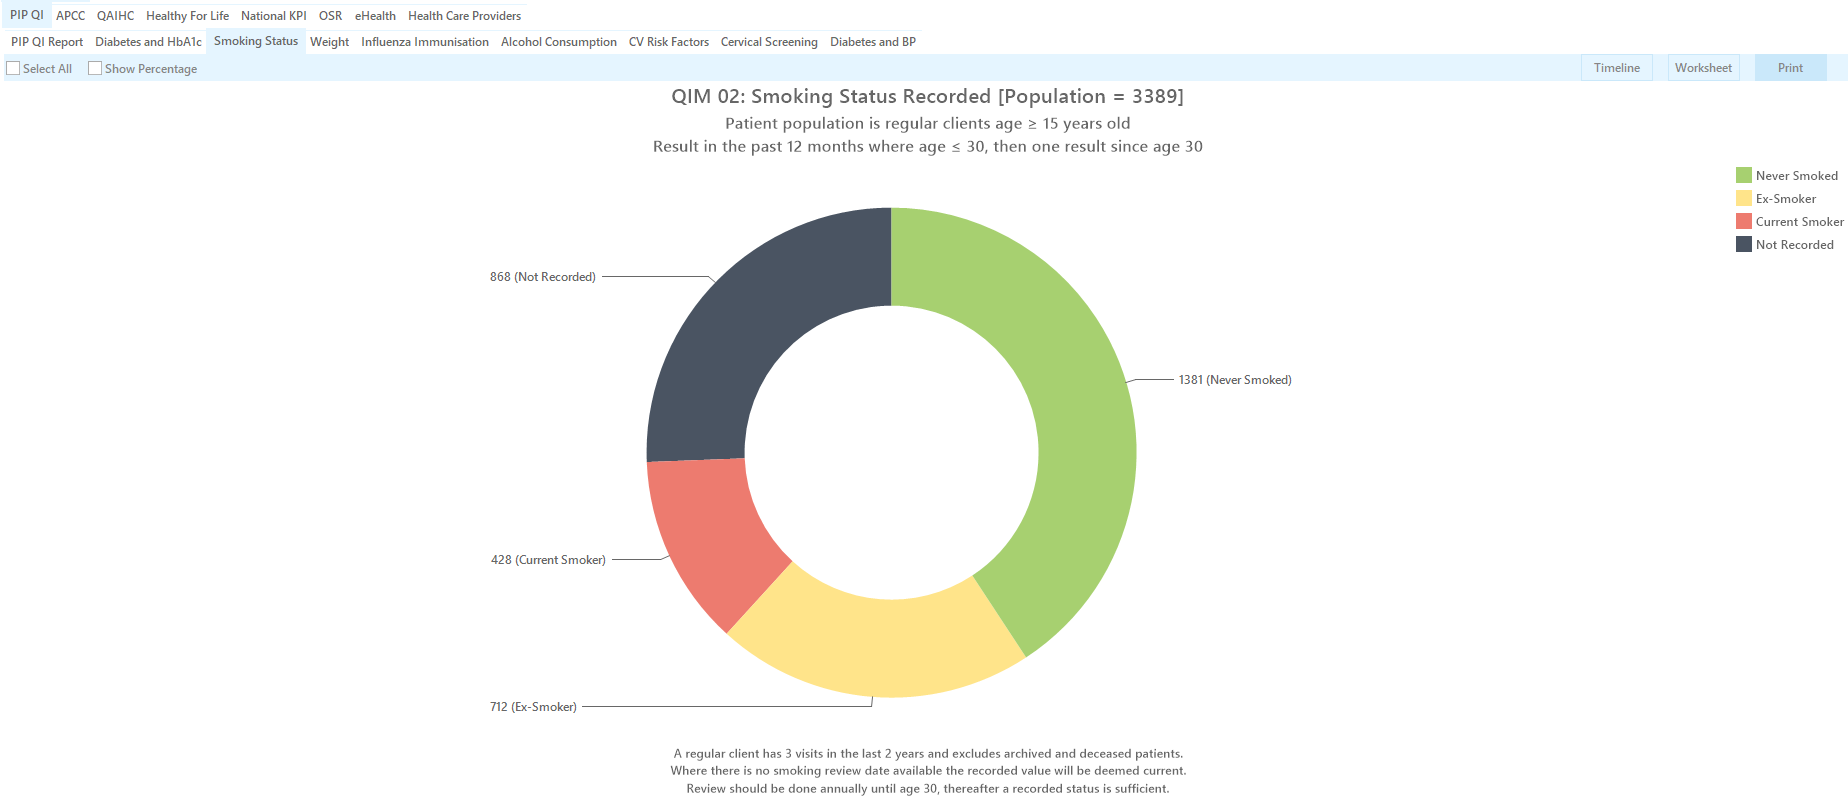
QIM02: Smoking Status
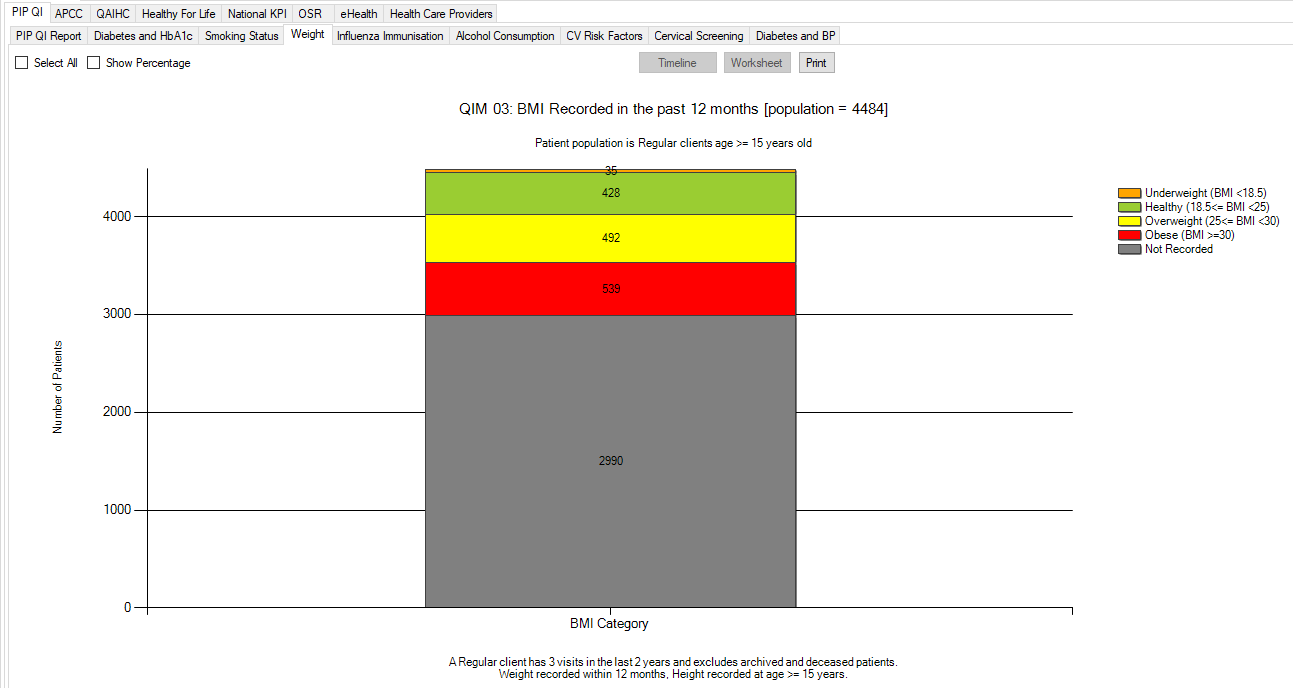
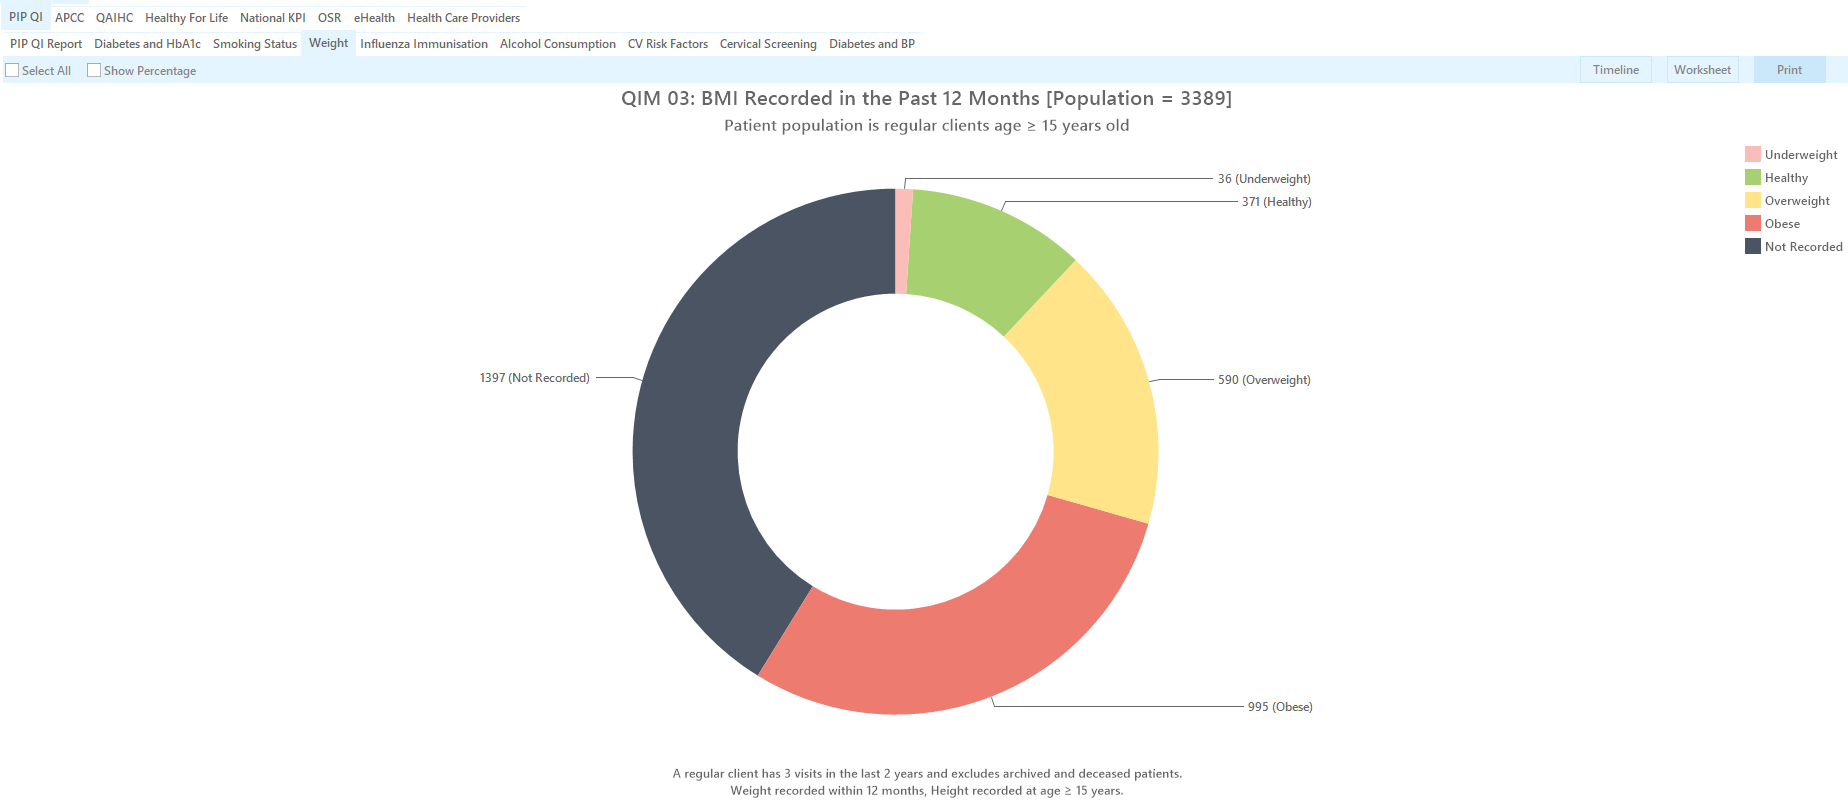
QIM03: Weight/BMI
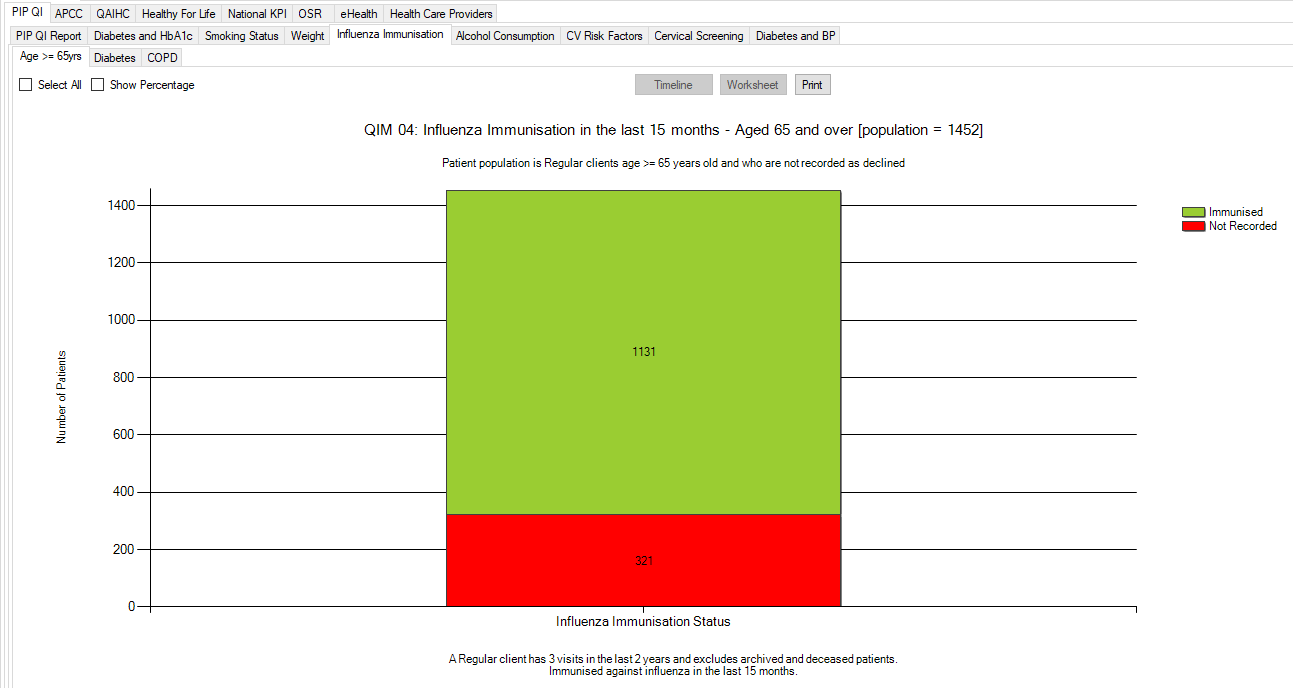
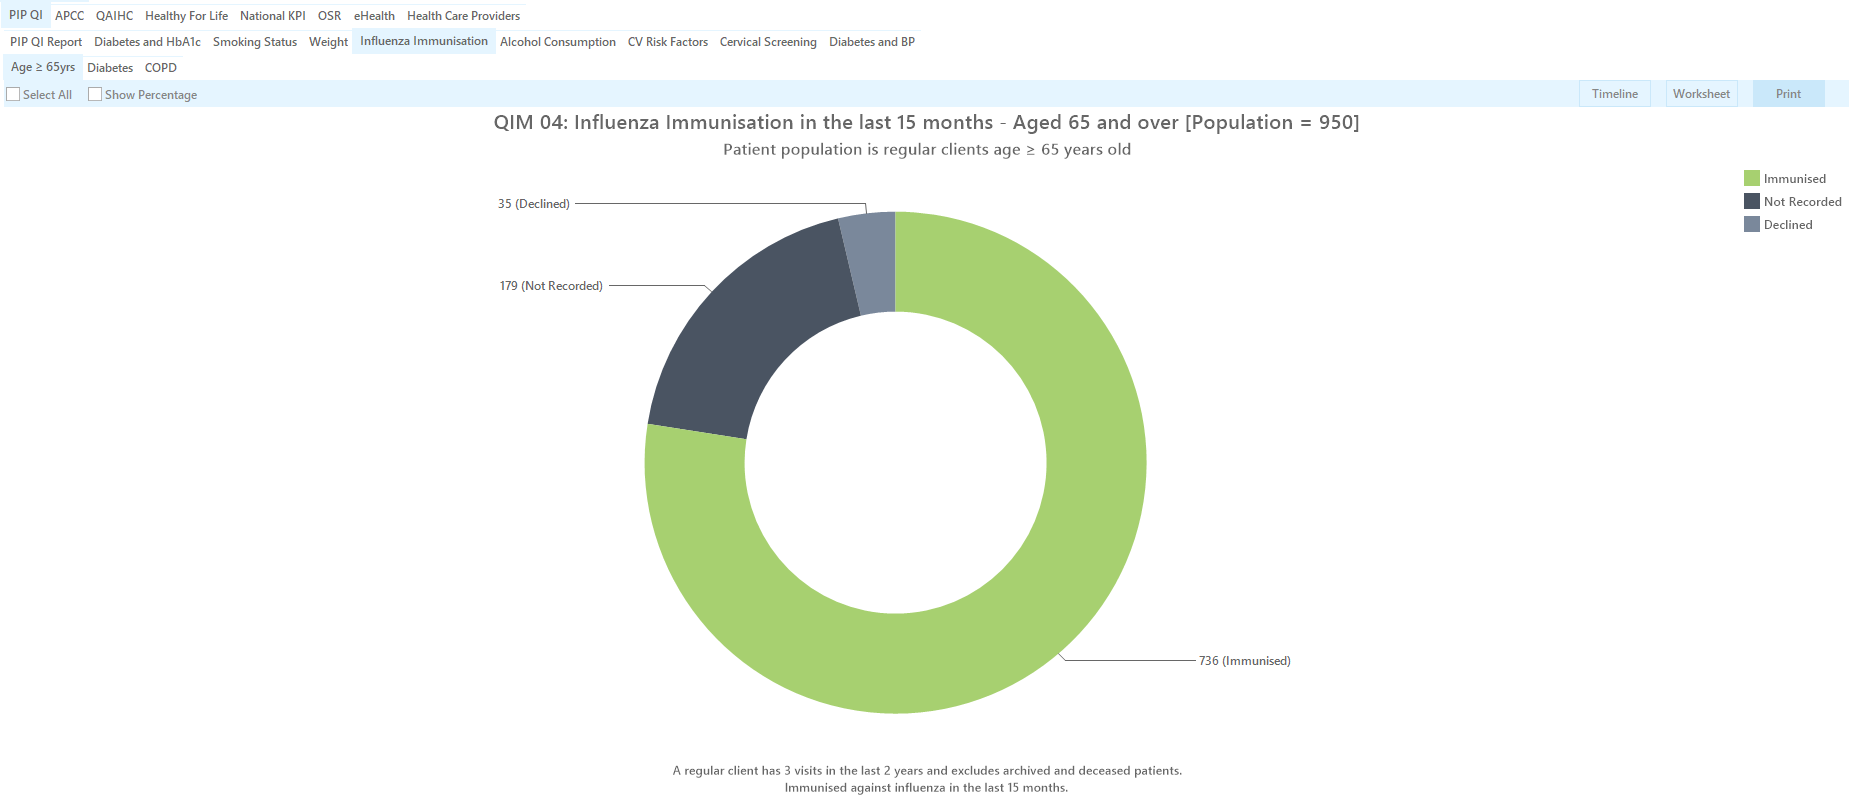
QIM04/05/06 Influenza Immunisation (- please note that there are three tabs to show reports for patients aged >=65, patients with diabetes and patients with COPD
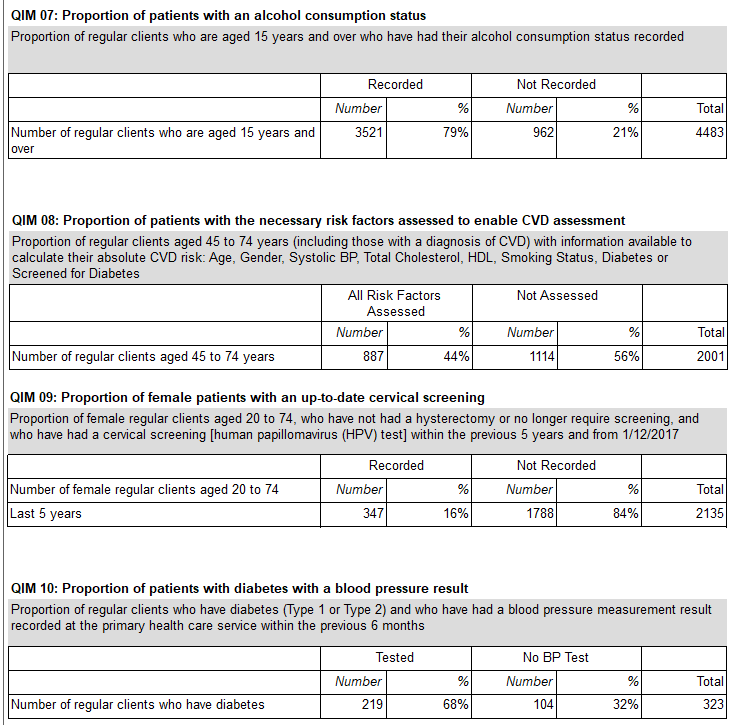
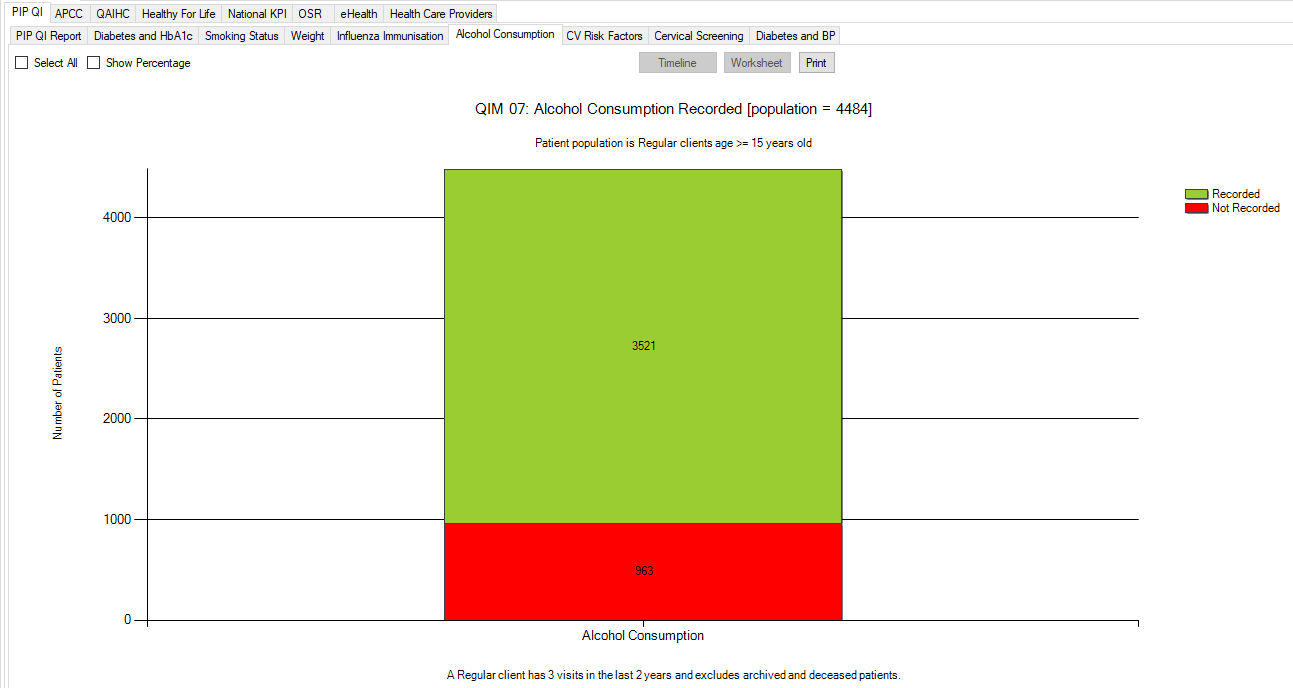
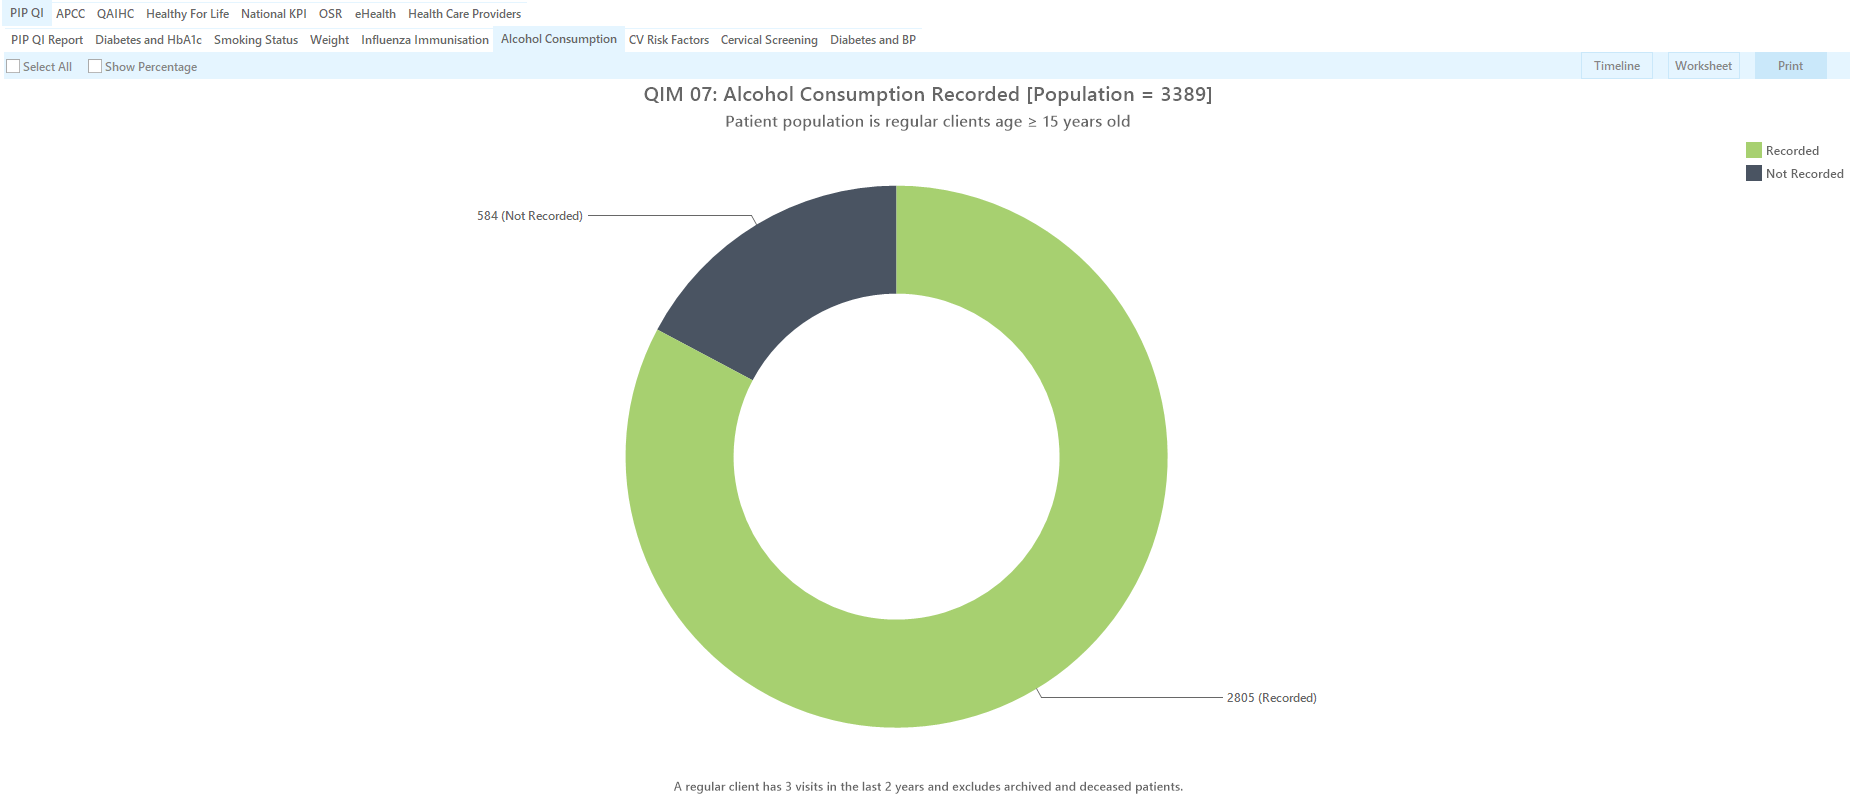
QIM07: Alcohol
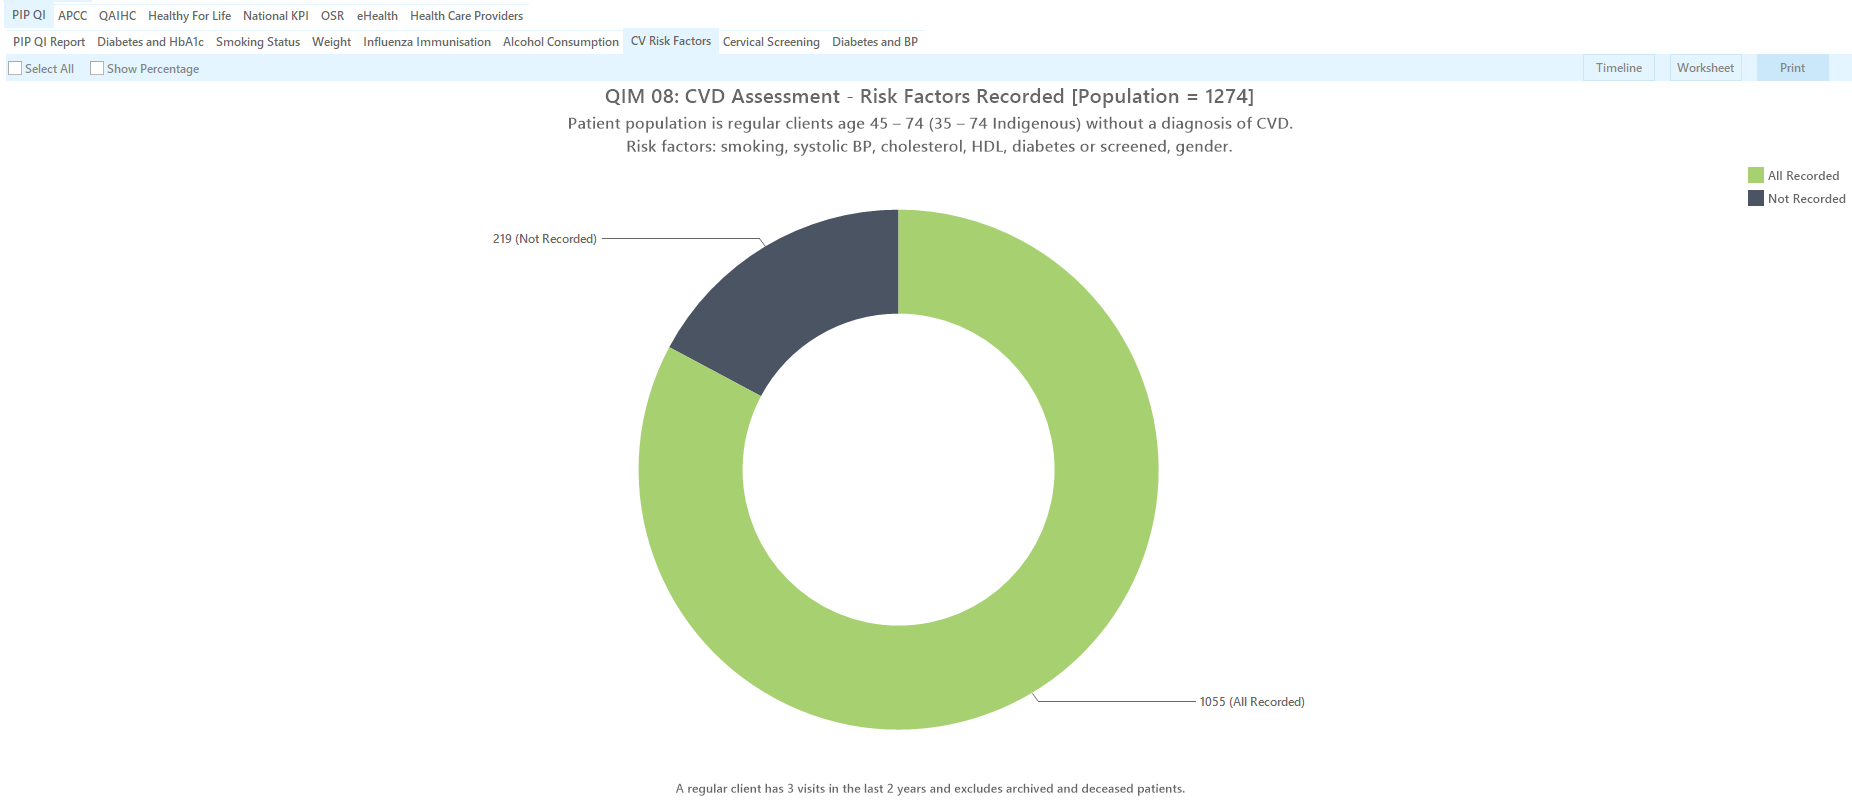
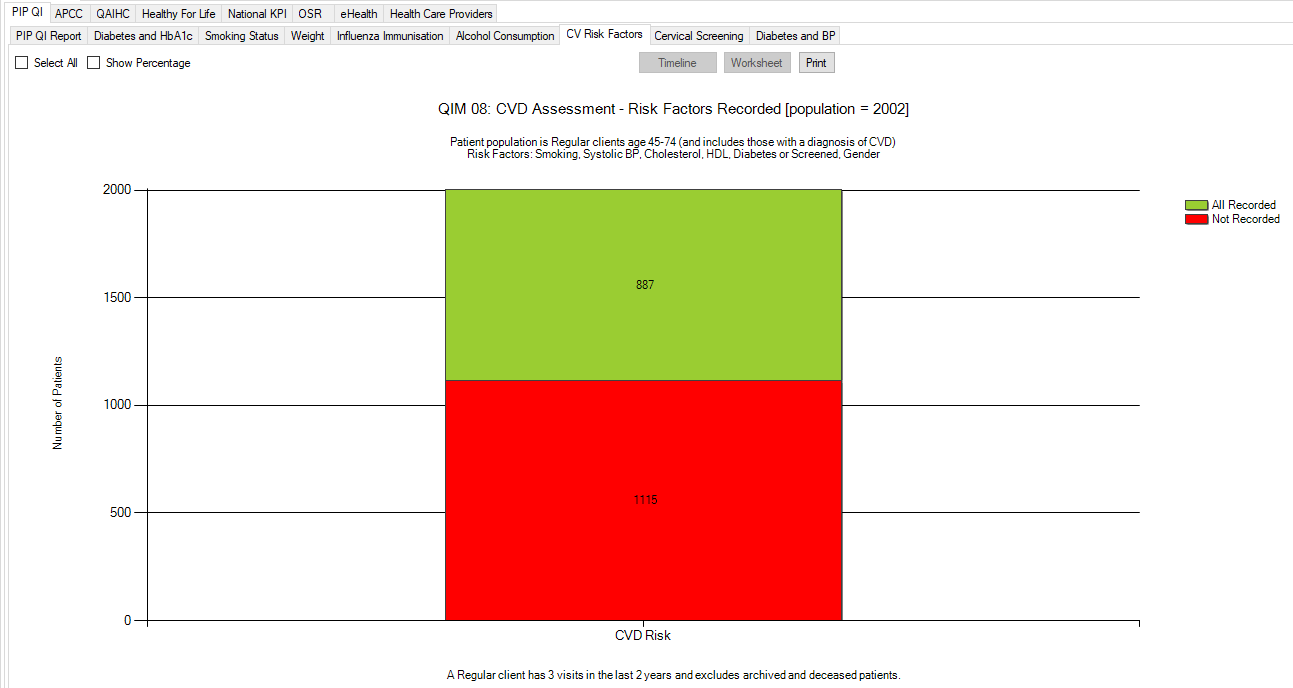
QIM08: CV Risk Factors
This report using the following criteria provided by the Department of Health:
Proportion of regular clients aged 45 to 74 years, who have had all of the following information recorded:
- Tobacco smoking
- Diabetes
- Diabetes status: Type 1 or Type 2 Diabetes OR
- Diabetes risk: Fasting Glucose Test result, or a screening for glycosylated haemoglobin (HbA1c test result)
- Systolic blood pressure
- Total cholesterol and HDL cholesterol levels
- Age
- Sex
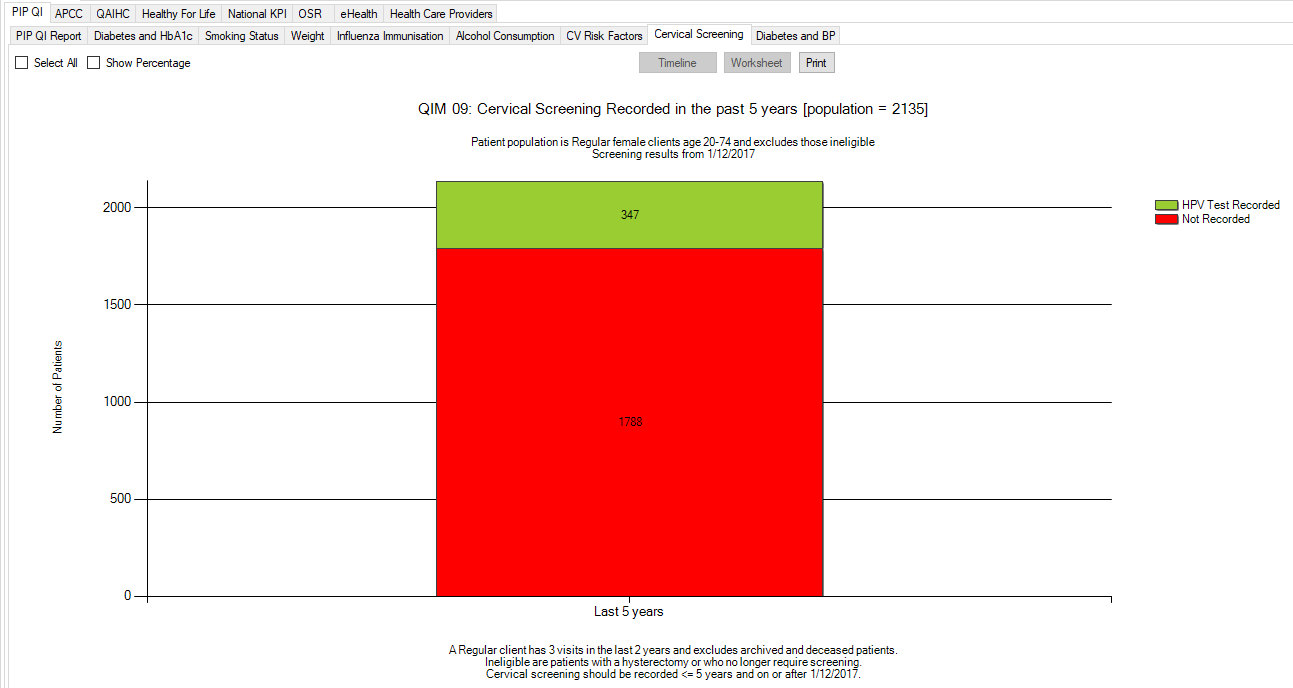
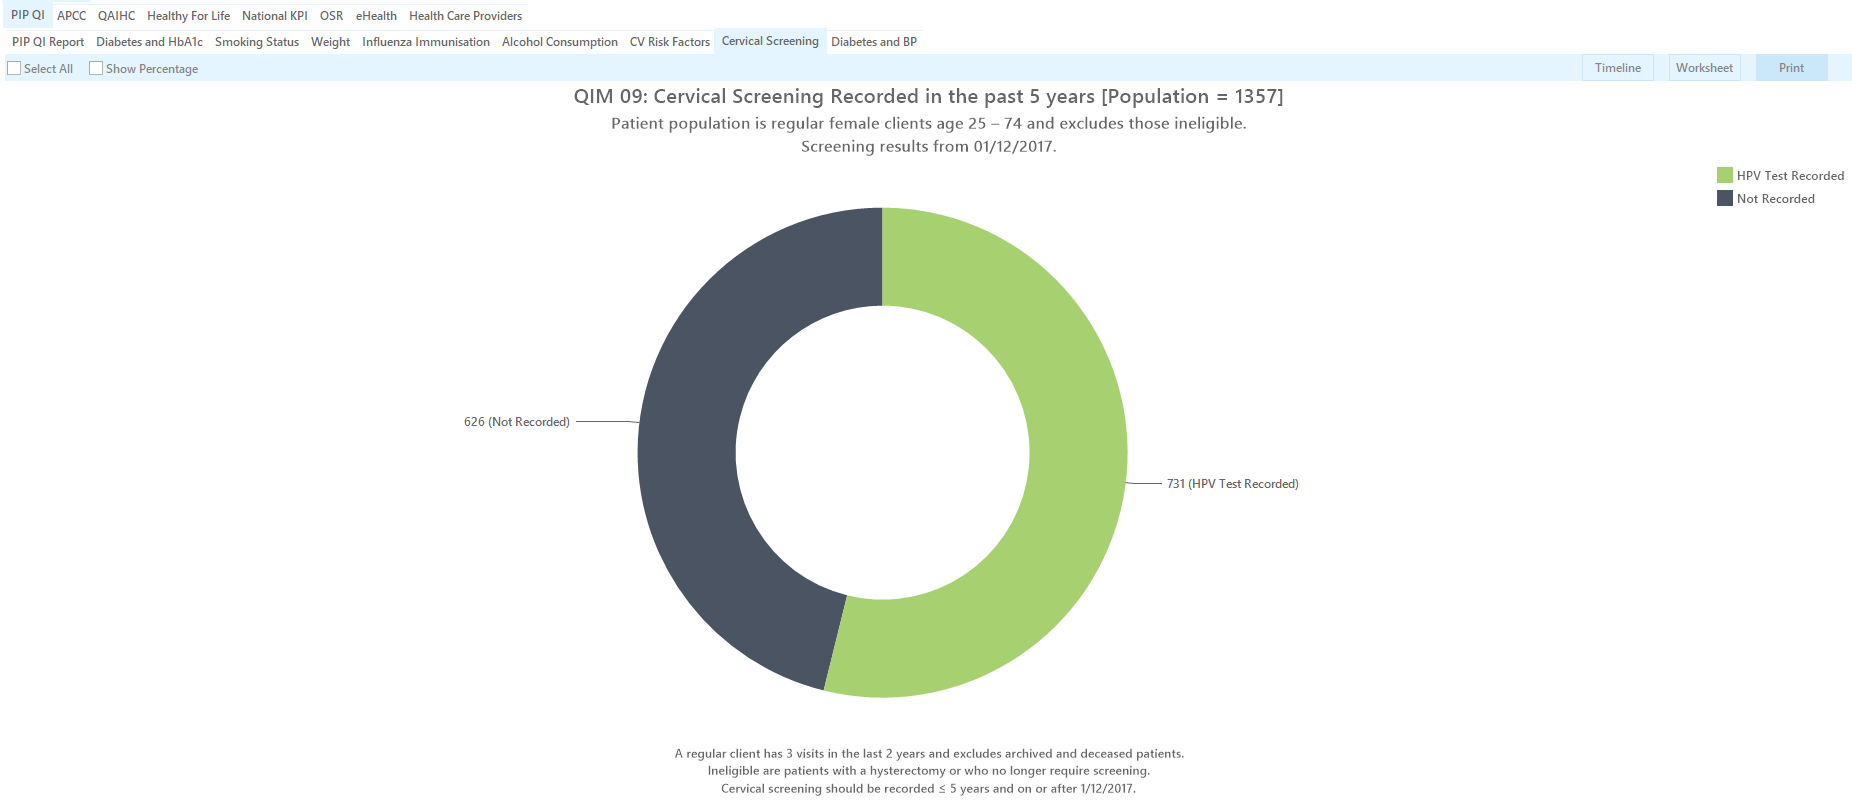
QIM09: Cervical Screening
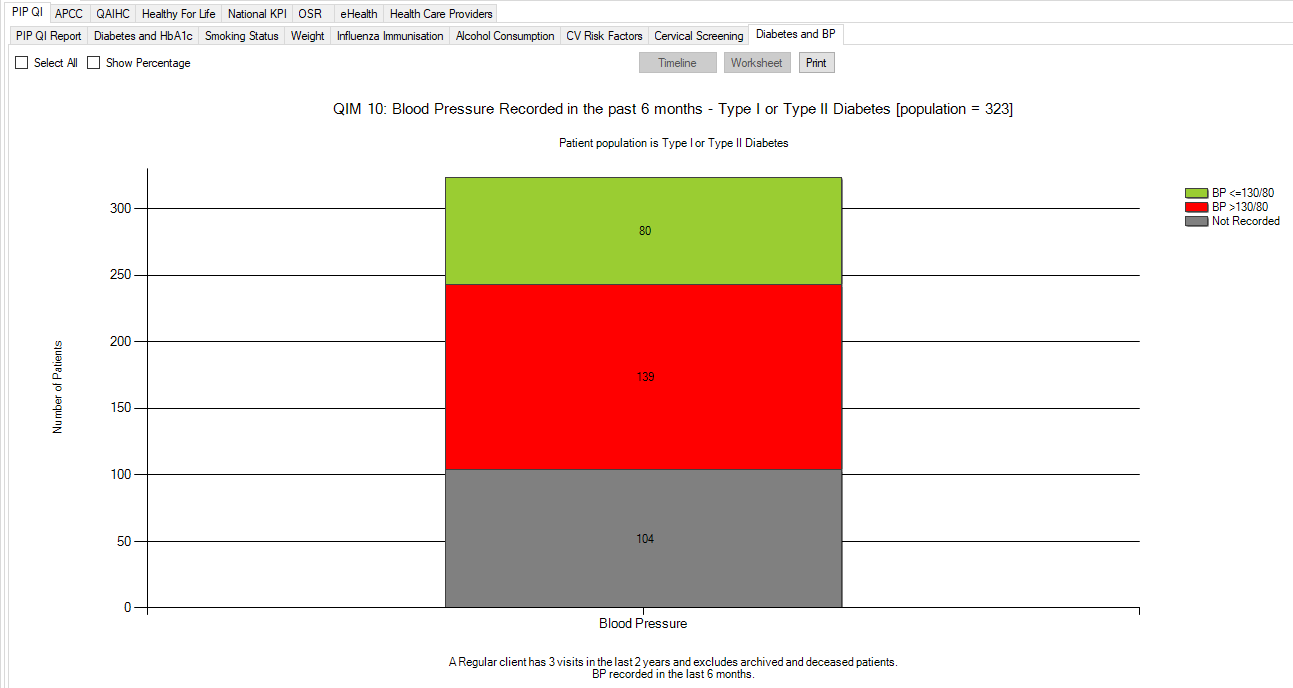
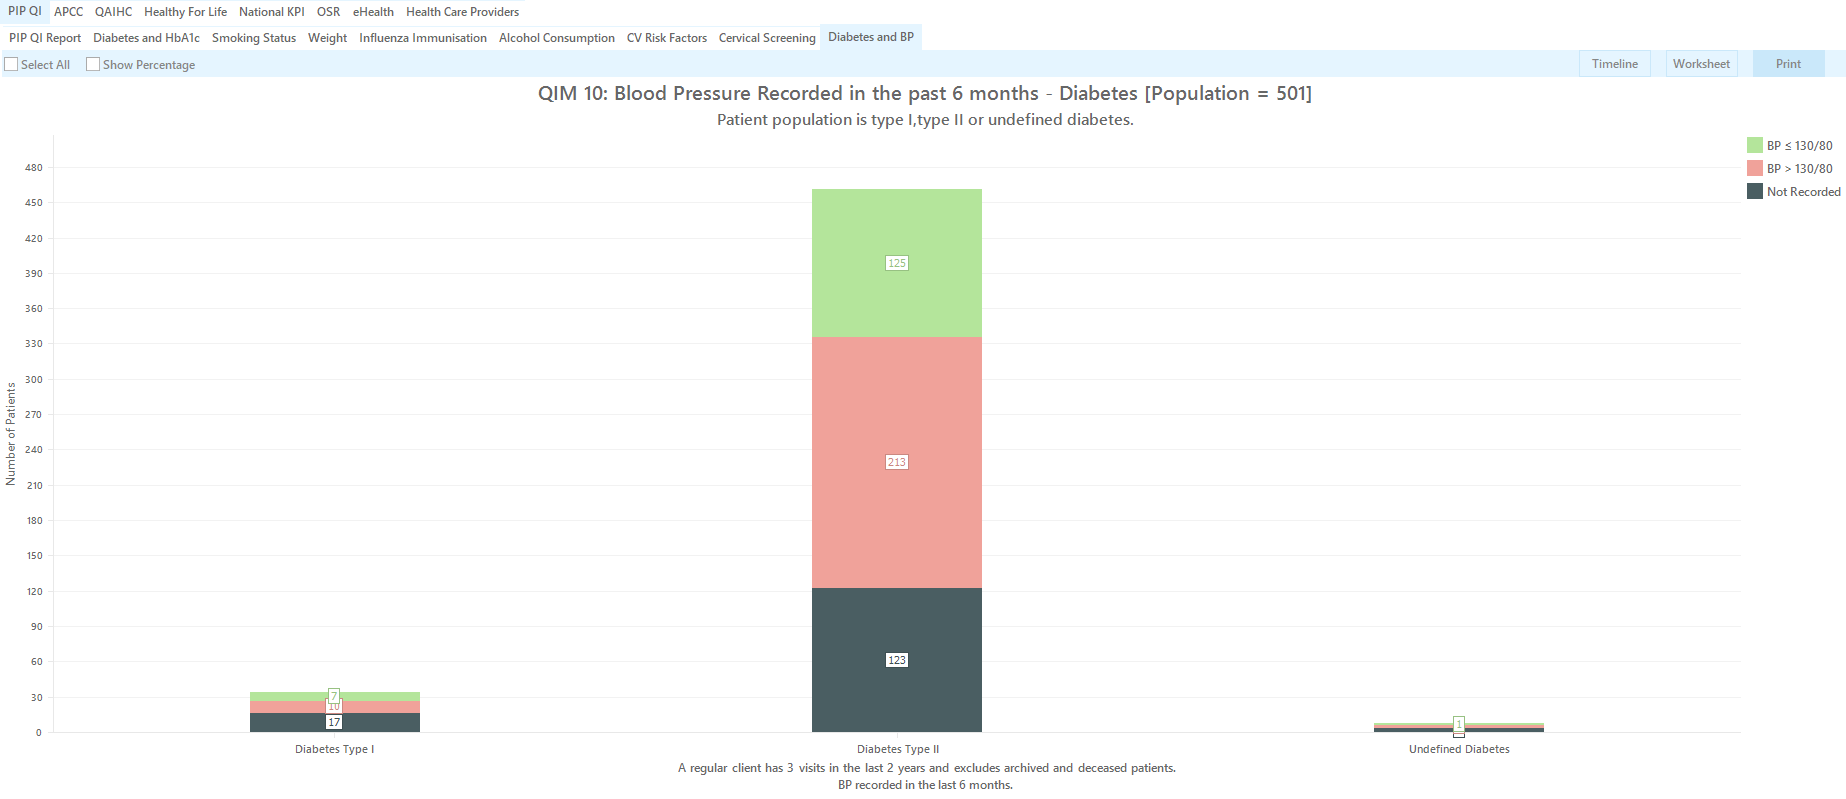
QIM10: Diabetes and Blood Pressure