Page History
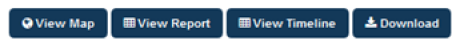
Every report tab has the options below to work with the data represented as a graph in the report.
- View Map will open the map view - please see VIEW MAP FUNCTION for full details
- View Report will show the data in a table as detailed below
- View Timeline will show a line graph - please see TIMELINE REPORTING for full details
- Download will download the data in CSV format - please note that all filters will be applied to the downloaded data, but not your show/hide column preferences
Clicking on View Report will open a new window to show the data specific to the report selected. The example below is from the 'Smoking' report.
...