Page History
...
Recipe Name: | QIM 10 – Blood pressure for patients with diabetes* |
Rationale: | Diabetes was the underlying cause of around 10% of all deaths in Australia in 2016 and recent reports show death rates for people with type 2 diabetes are rising. For people with type 1 or type 2 diabetes, monitoring blood pressure can help assure appropriate medical care to lower the risk of macro vascular (stroke, heart attack and heart failure) and microvascular (kidney disease, eye disease and peripheral neuropathy) complications. |
Target: | Proportion of regular clients who have Type 1 or , Type 2 or undefined diabetes and who have had a blood pressure measurement result recorded at the primary health care service within the previous 6 months. |
CAT Starting Point: |
|
| Warning |
|---|
| Please note that the improvement measure is defined for patients with diabetes type I or type II. In this recipe patients with 'undefined' diabetes will be included, so it is a good idea to clean up your diabetes register regularly. However any patients with a free text diagnosis of diabetes will not be included in the report. Here is a recipe that shows the steps: Clean up the diabetes register |
CAT4 starting point
- Active selected
RECIPE Steps Filters:
In the “Conditions” Tab, under the “Chronic” category, select “Yes" in the Diabetes category. This will select all patients with diabetes.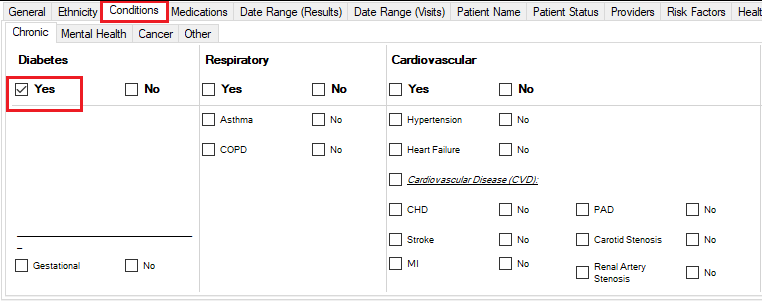
Then select the 6 month date range result filter, to only show results that were entered in the last 6 months:
...
The Measures/BP report will now show the blood pressure results for the last six months for the selected patients:
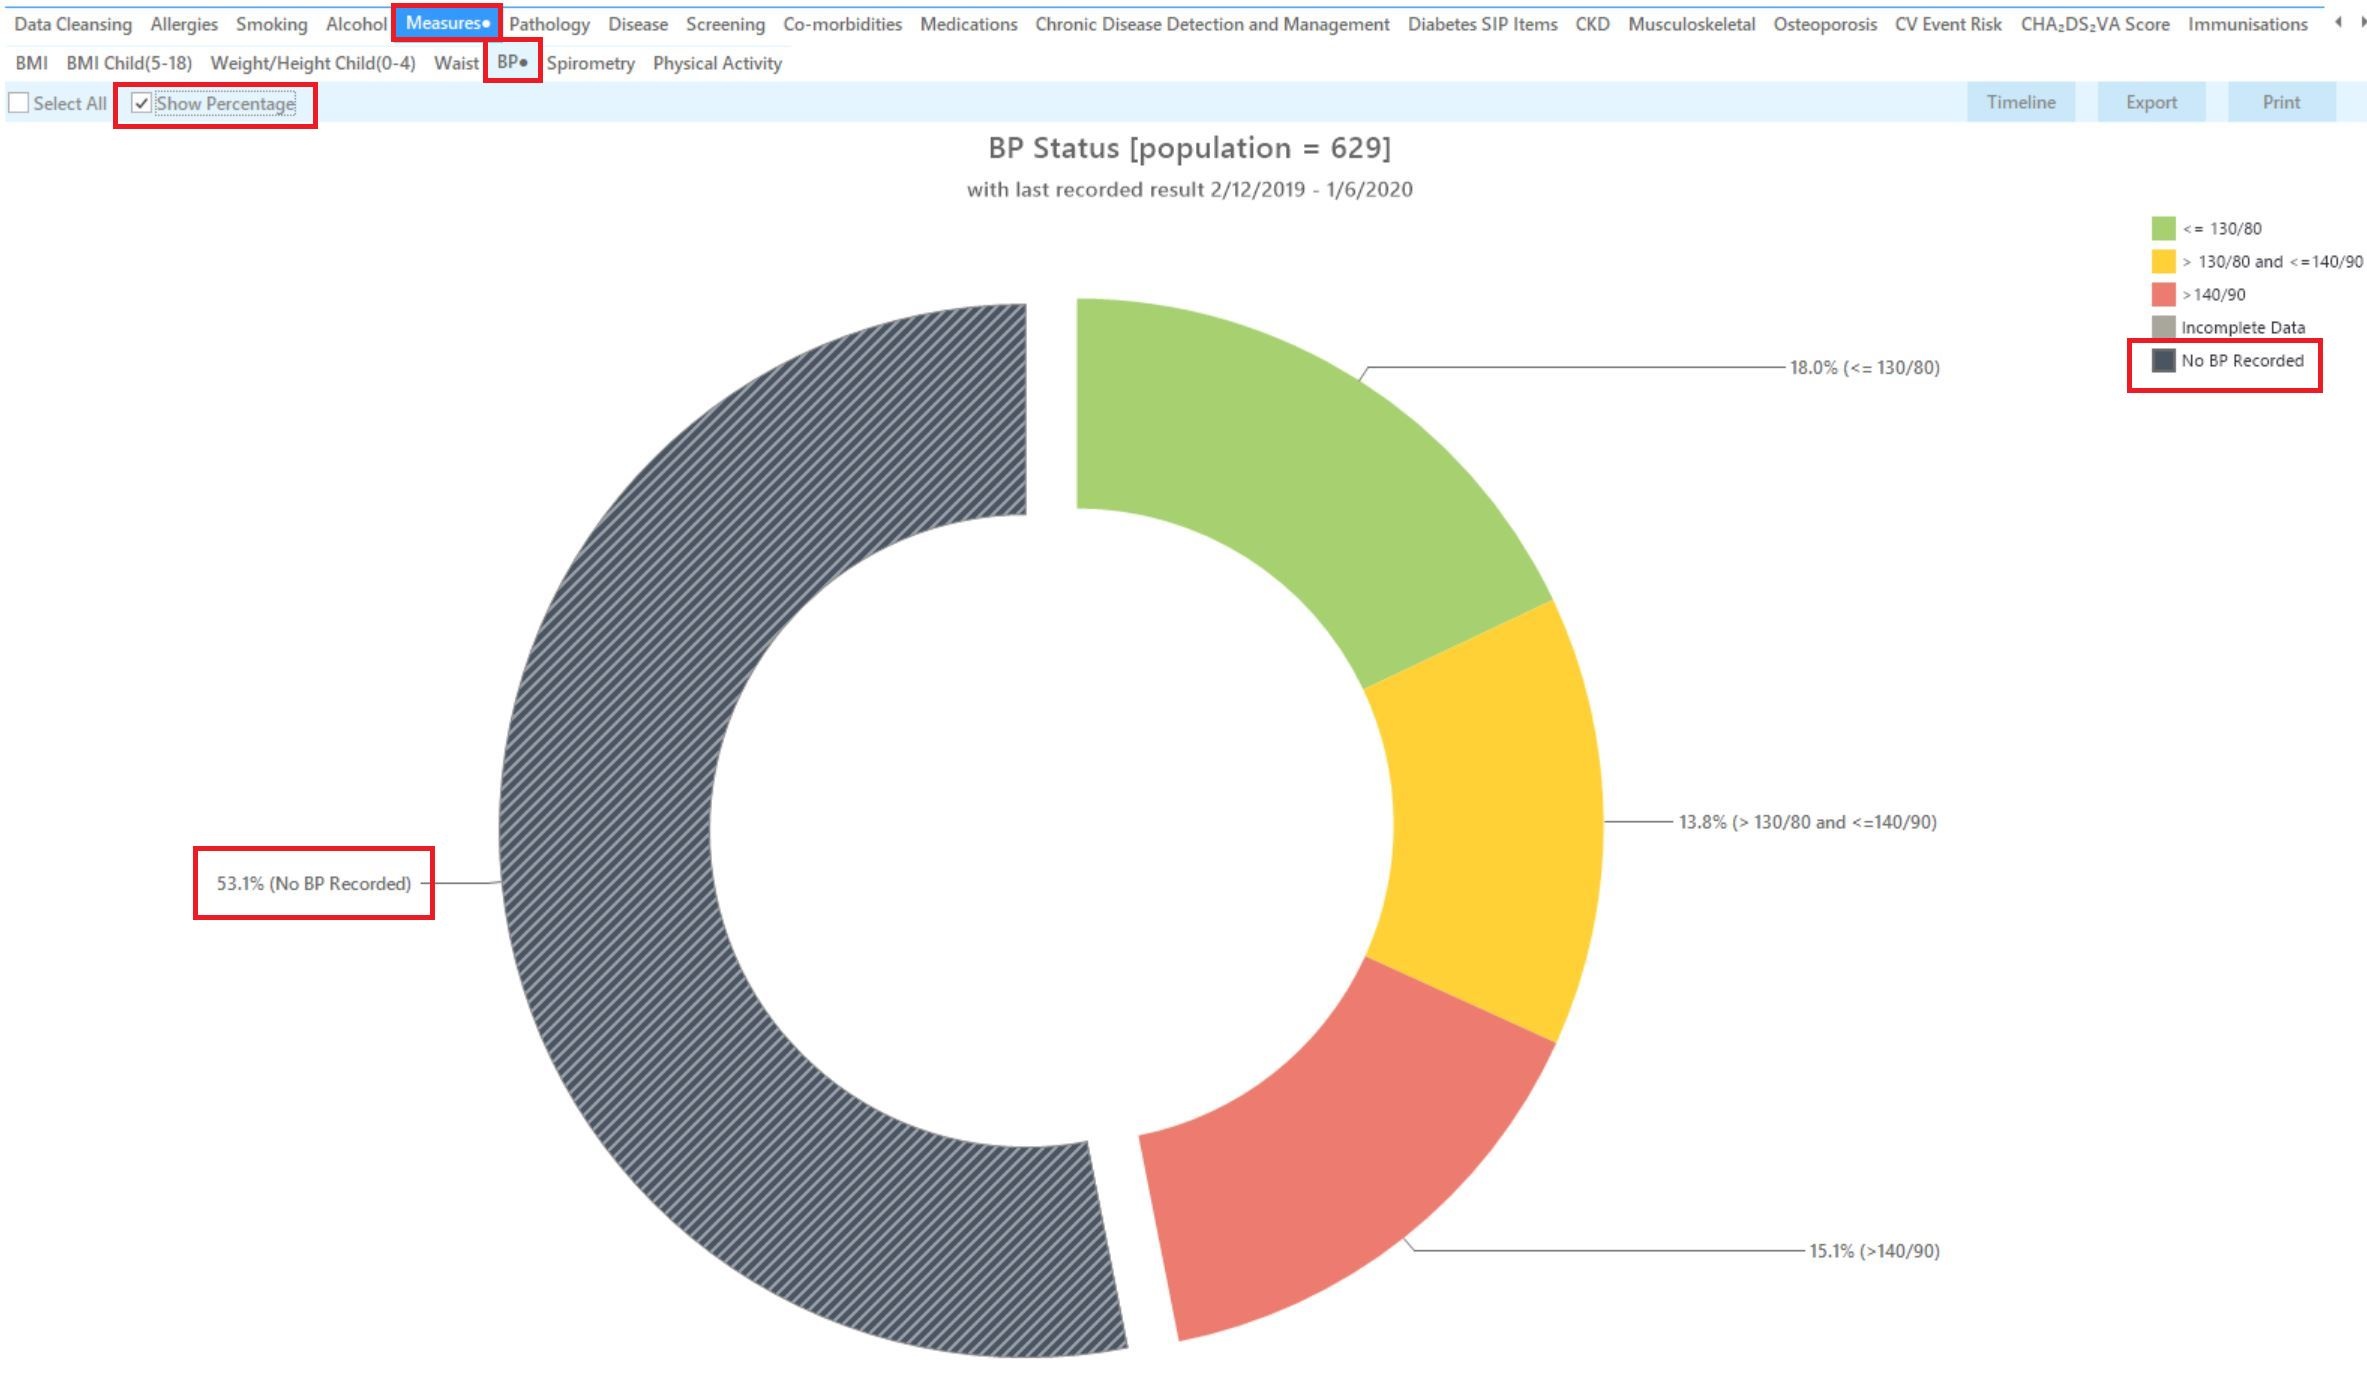
The BP report will show you the numbers/percentage of your patients BP status and will allow you to measure improvement over time by comparing reports. It will also allow you to see more details of those patients with a result by double clicking on a selected slice of the graph to see the patient details and measurements: 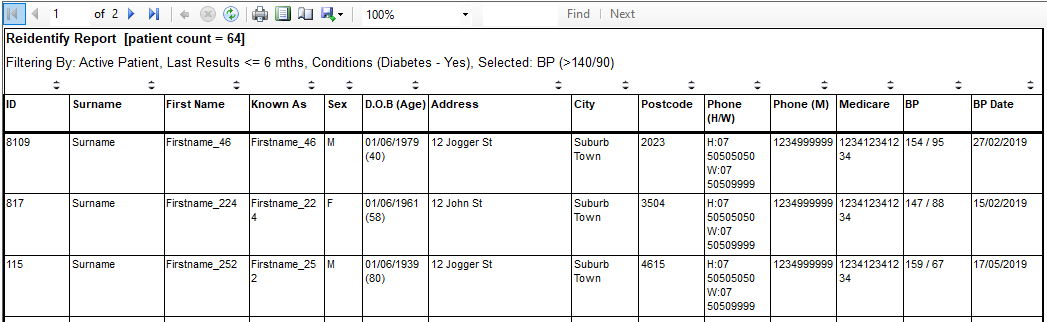 .
.
To Export Patient List to Microsoft Excel:
1. Click on the “Export Icon” Icon” at the top of the Patient Reidentification window.
2. Click on “Excel”
...