Page History
...
| Warning |
|---|
| All details on the calculation and definitions are provided in the header/footer of the report graphs. |
To create a JSON file to upload PIP QI aggregated data to your PHN, follow the steps in this guide: Create a PIP QI Aggregate Report from CAT4 in JSON Format
Here are the details of the reports available:
- PIP QI report - summary of all indicators in aggregate format
|
|
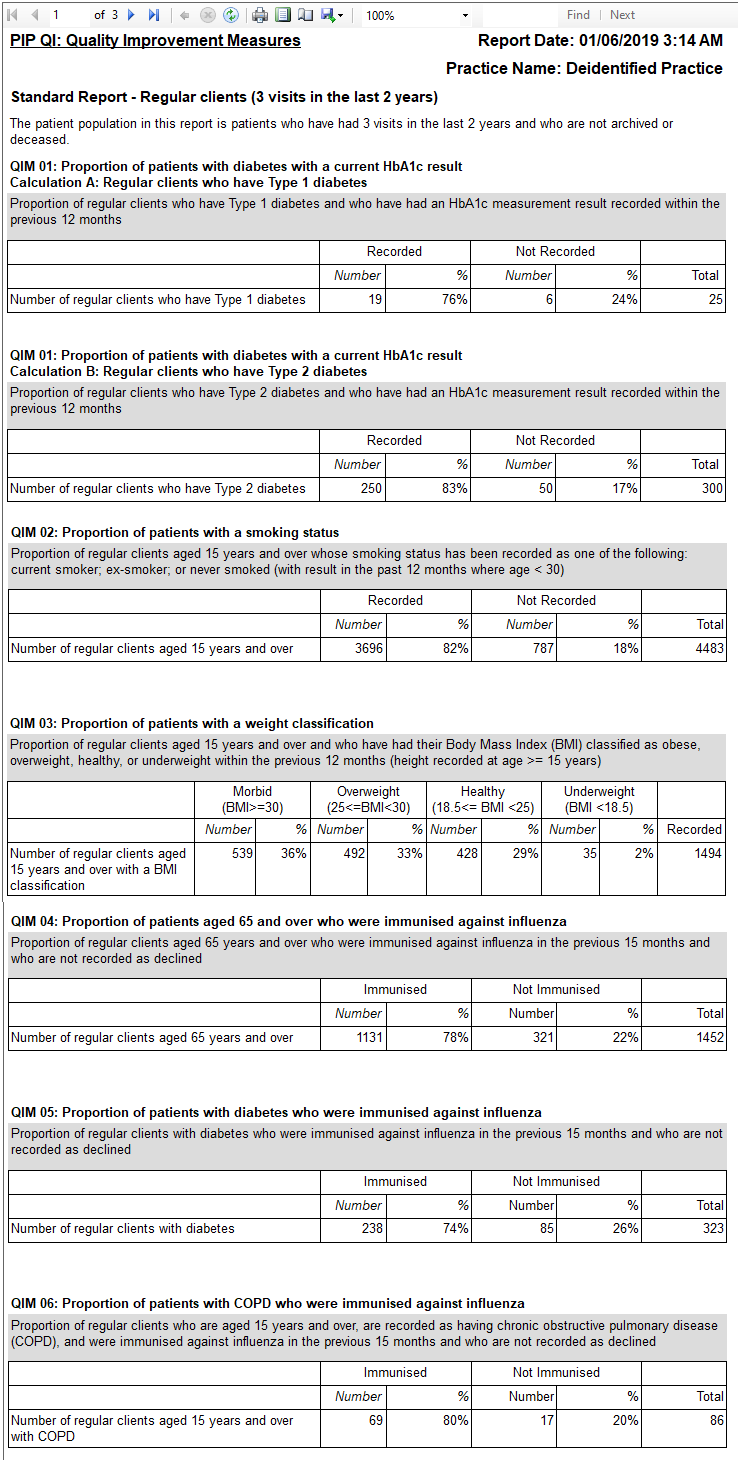
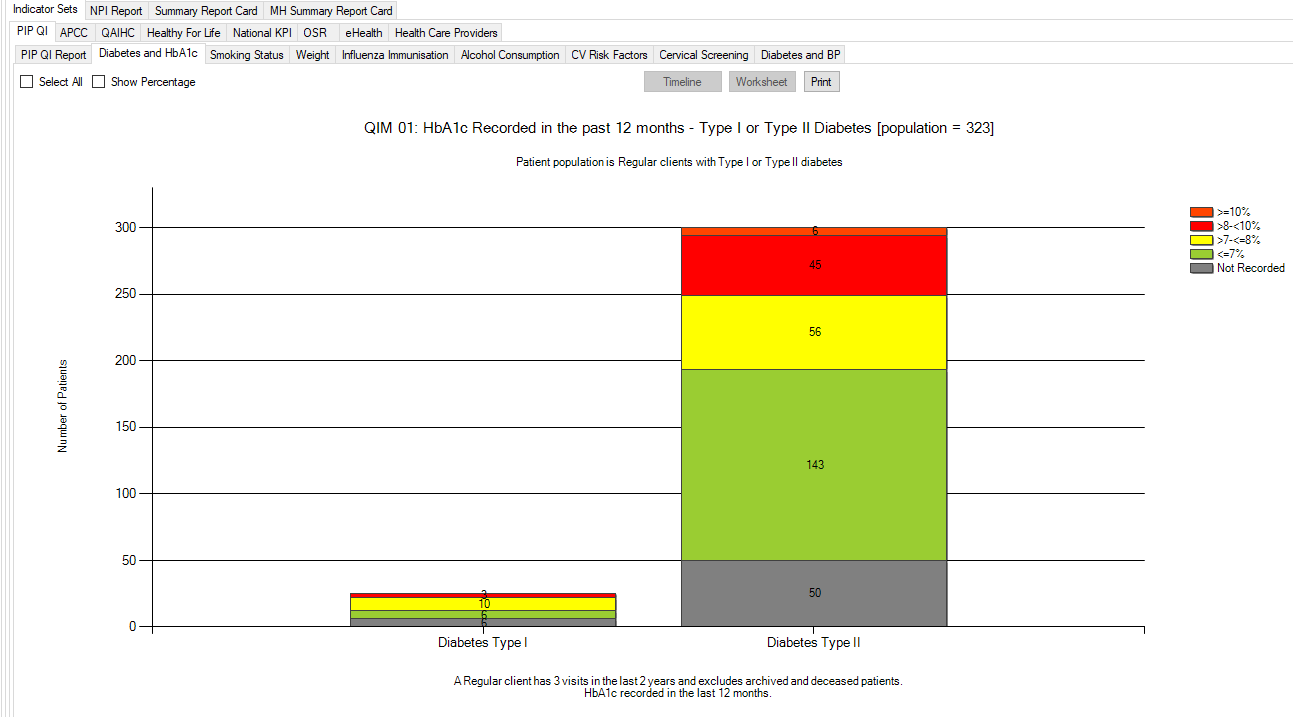
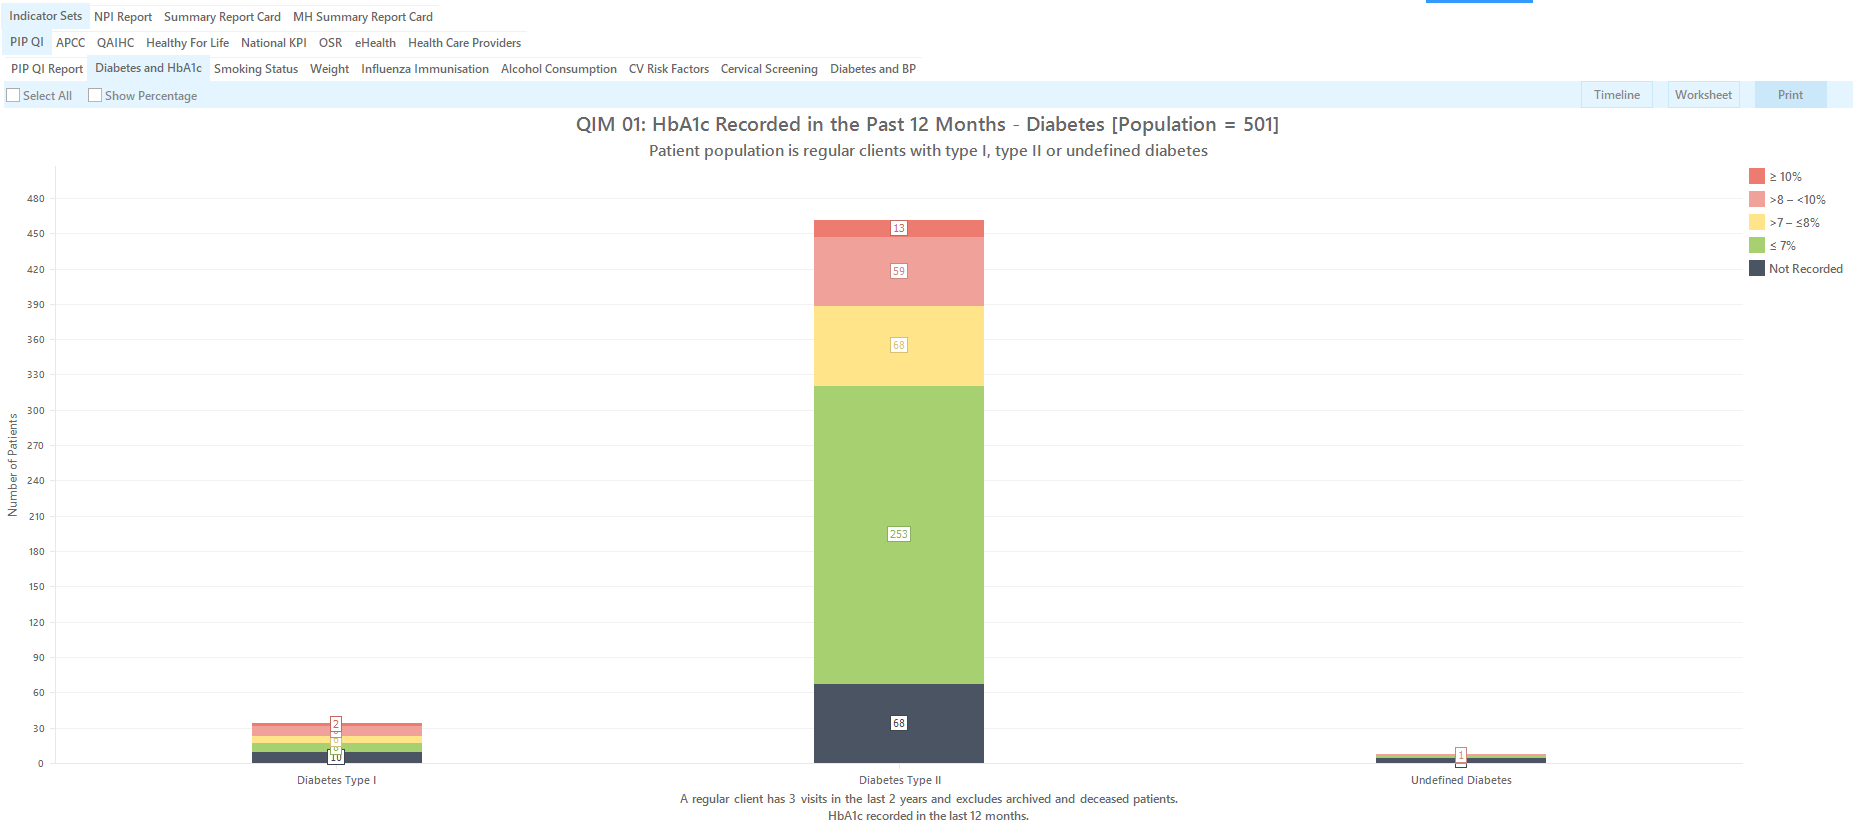
QIM01: Diabetes and HbA1c - regular patients with diabetes type 1 or type 2 and their HbA1c results in the last 12 months.
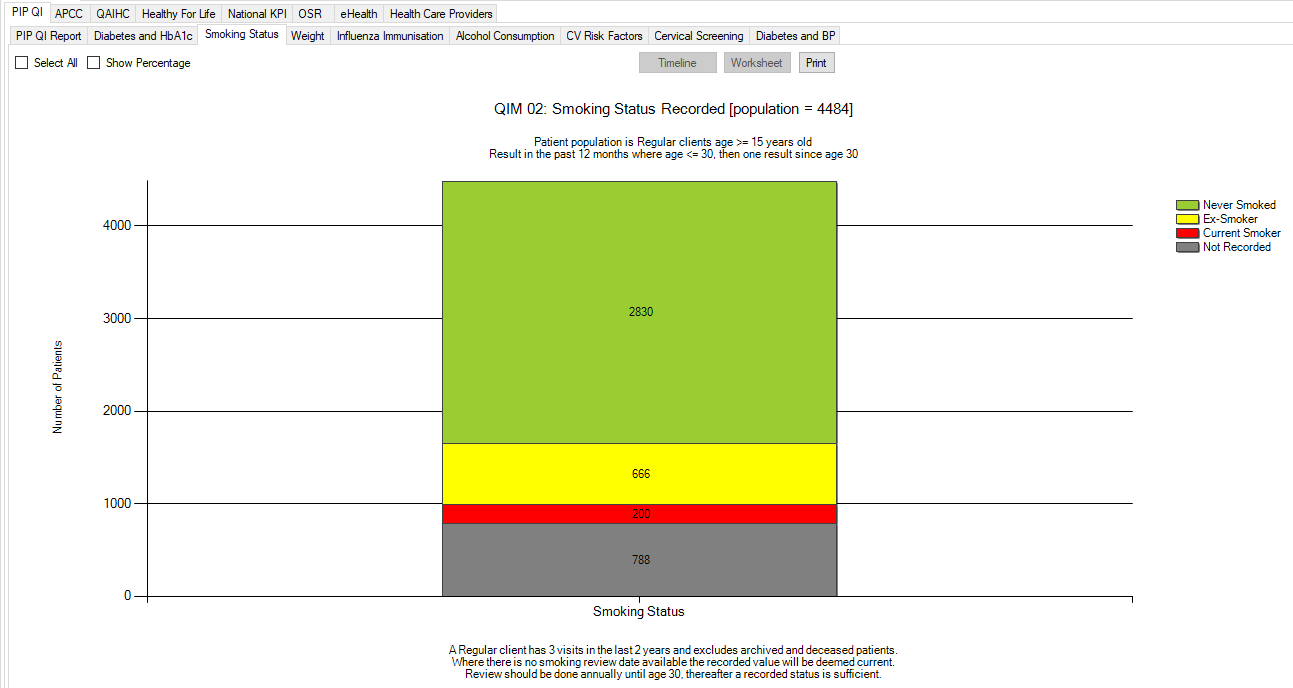
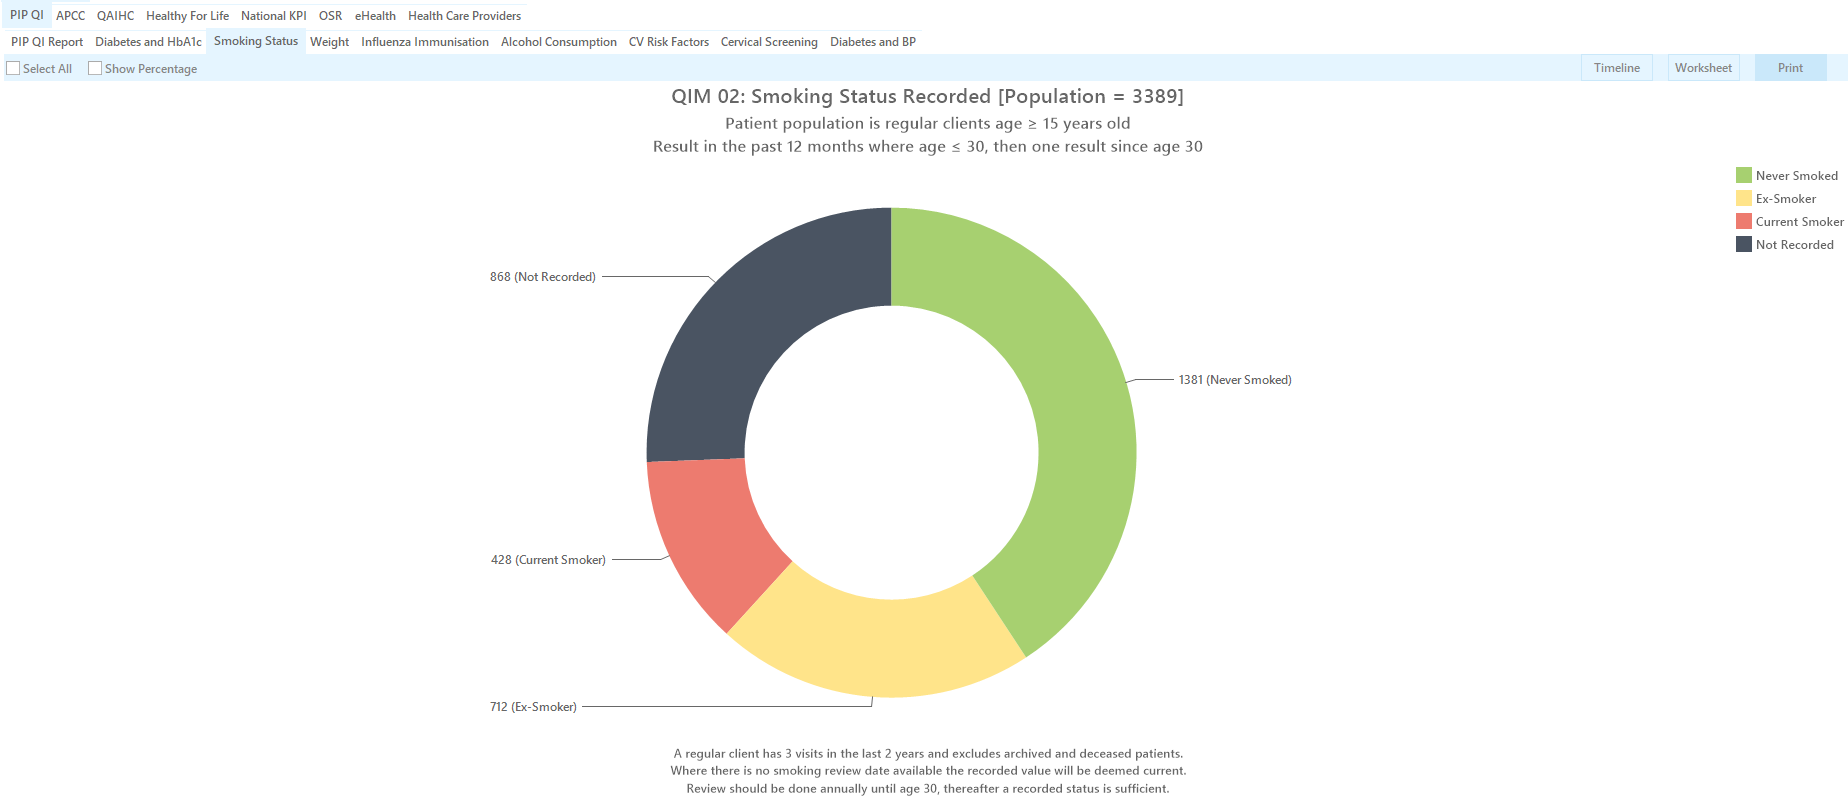
QIM02: Smoking Status
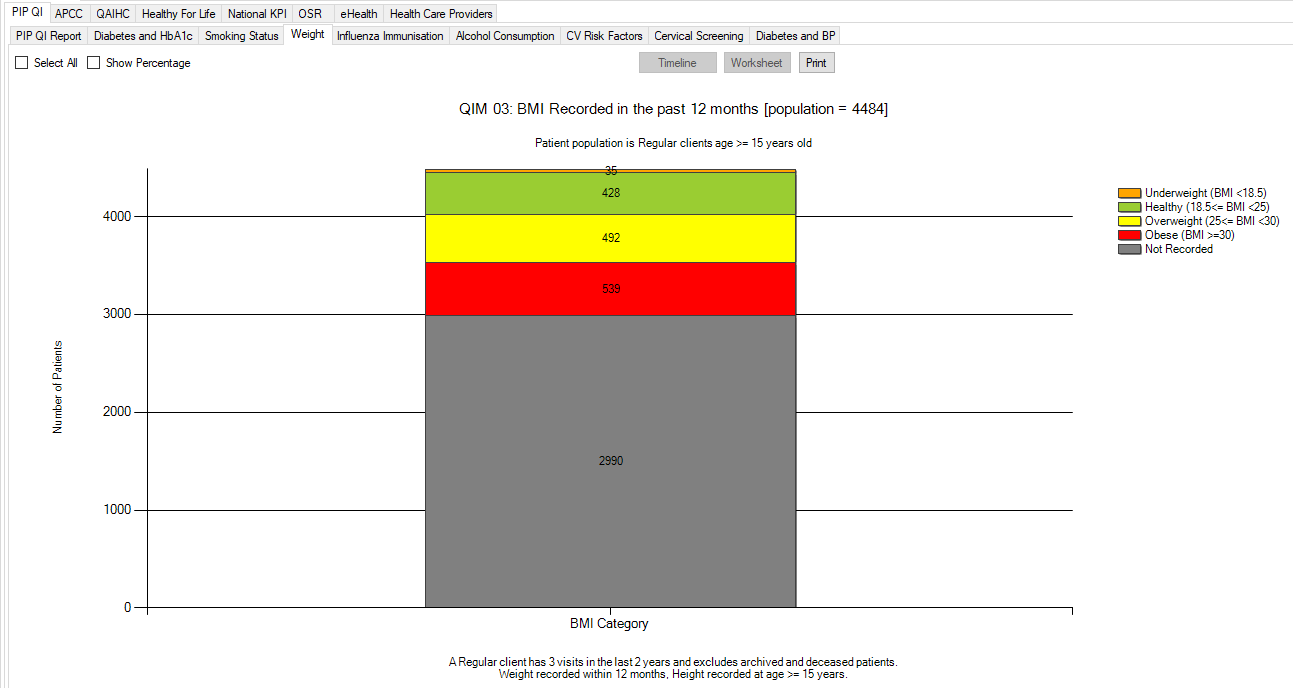
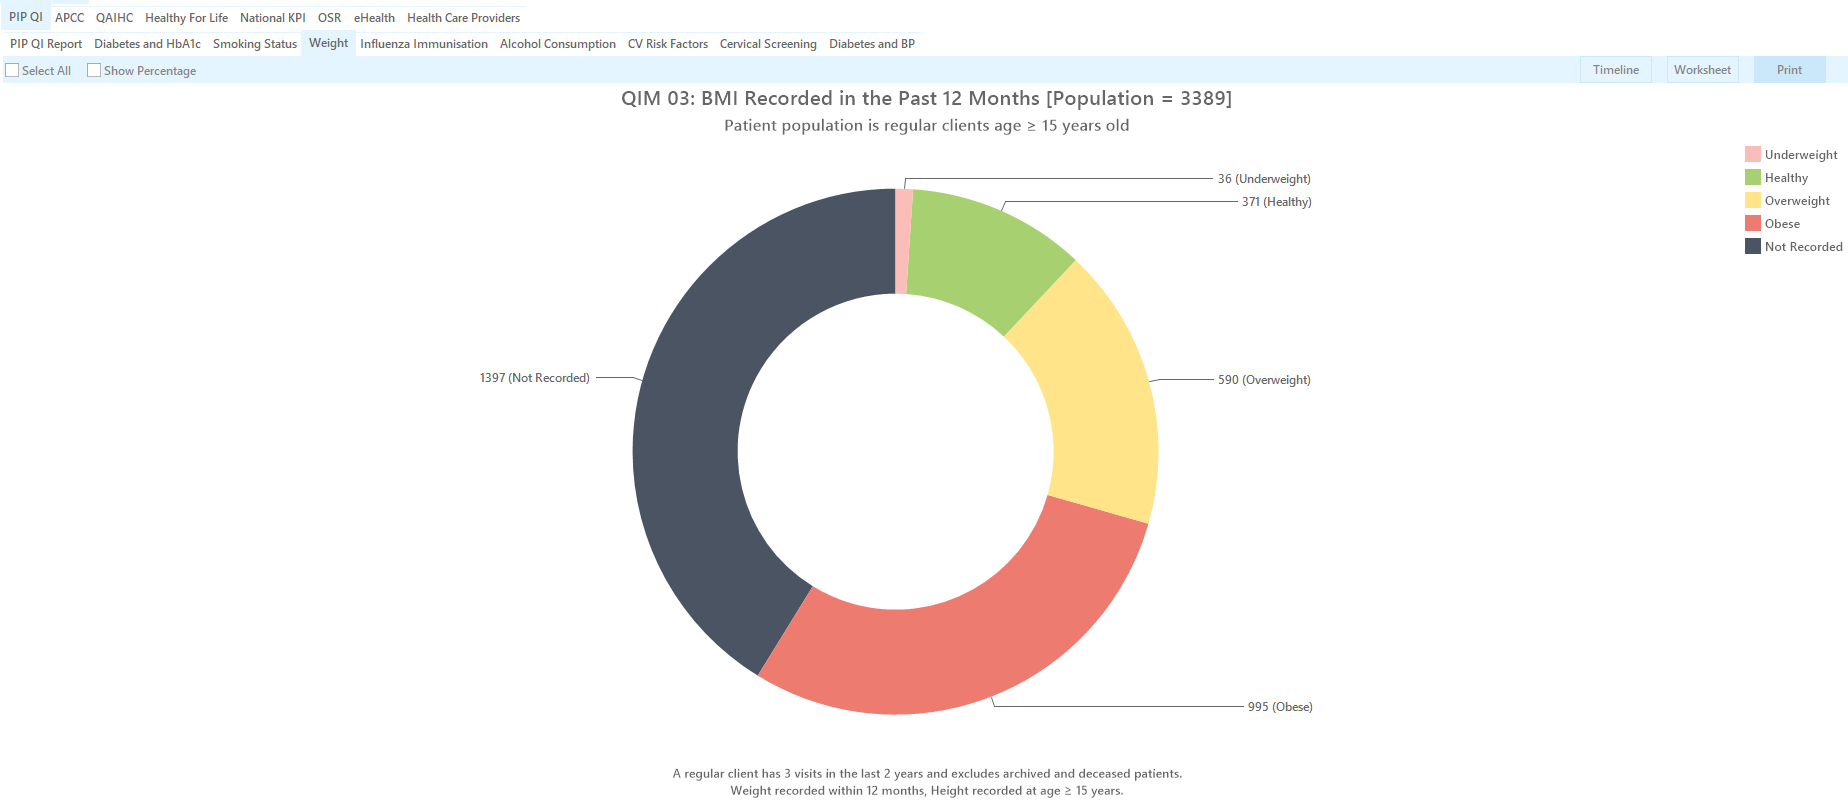
QIM03: Weight/BMI
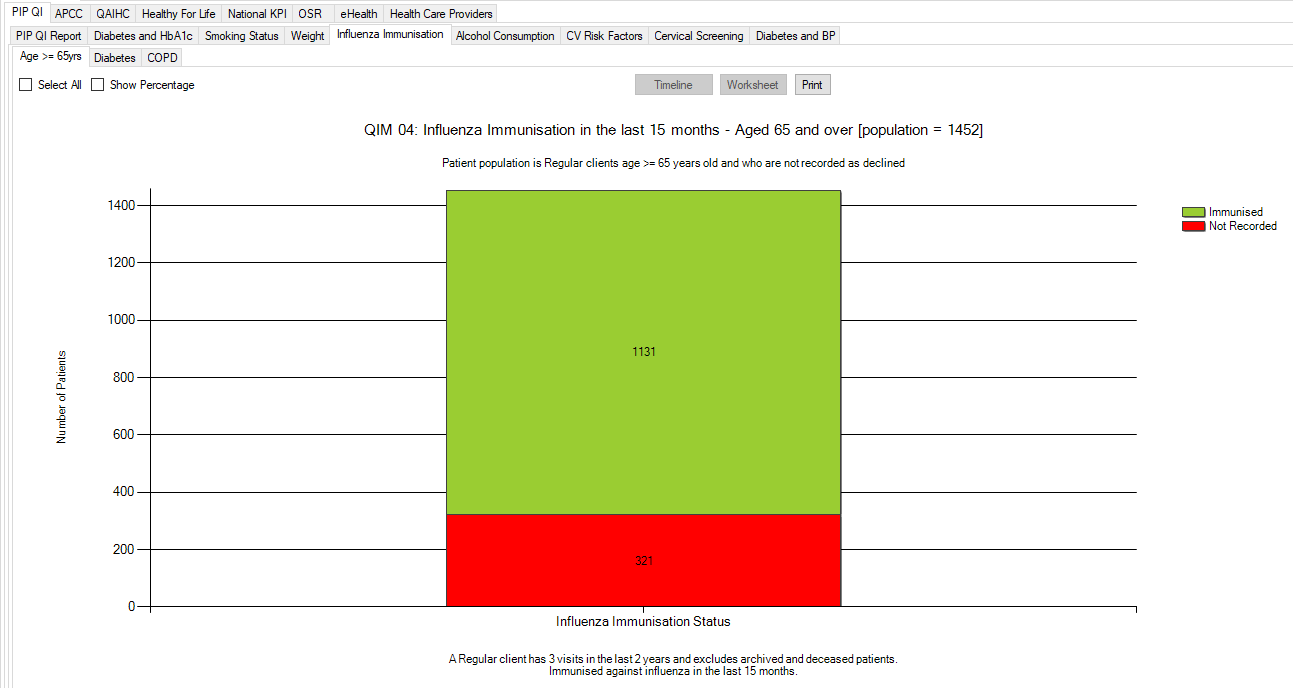
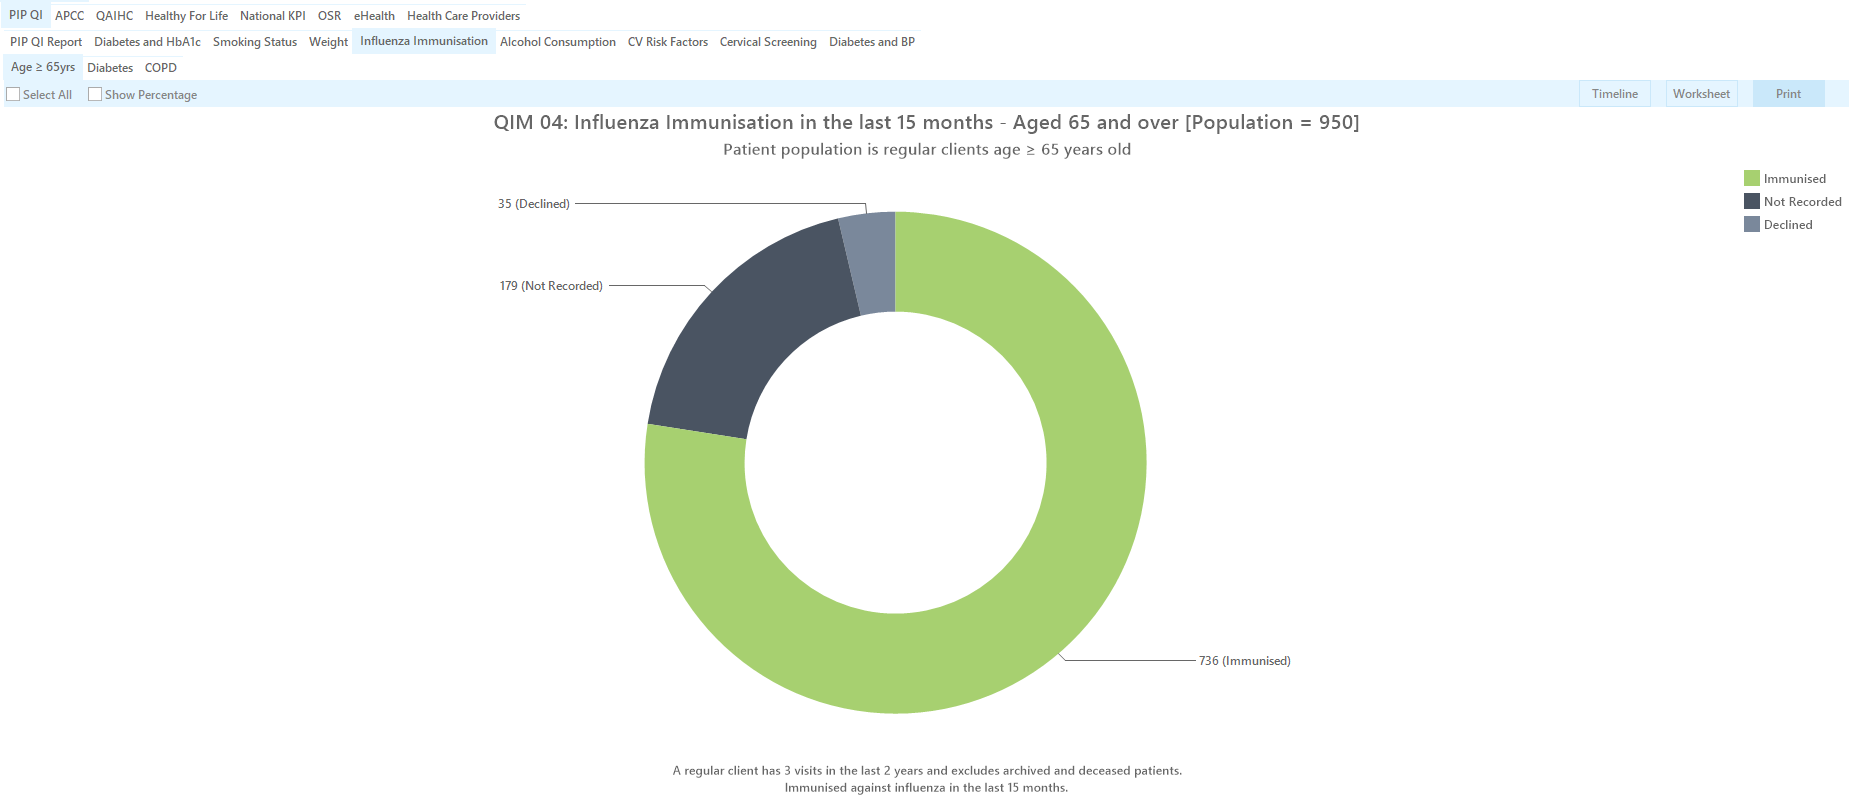
QIM04/05/06 Influenza Immunisation - please note that there are three tabs to show reports for patients aged >=65, patients with diabetes and patients with COPD
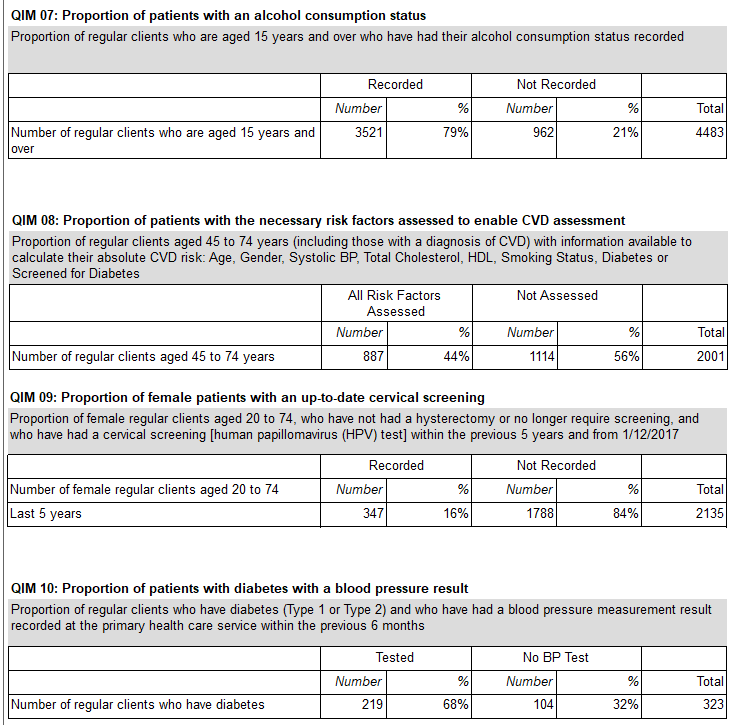
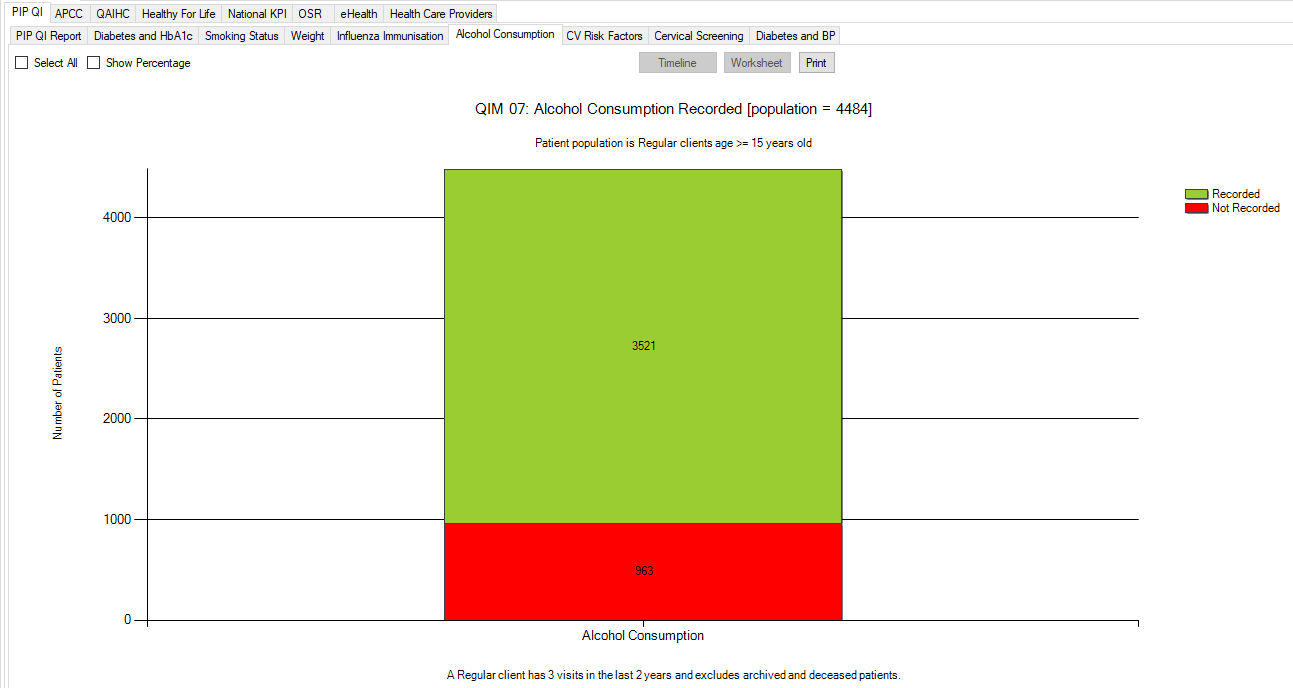
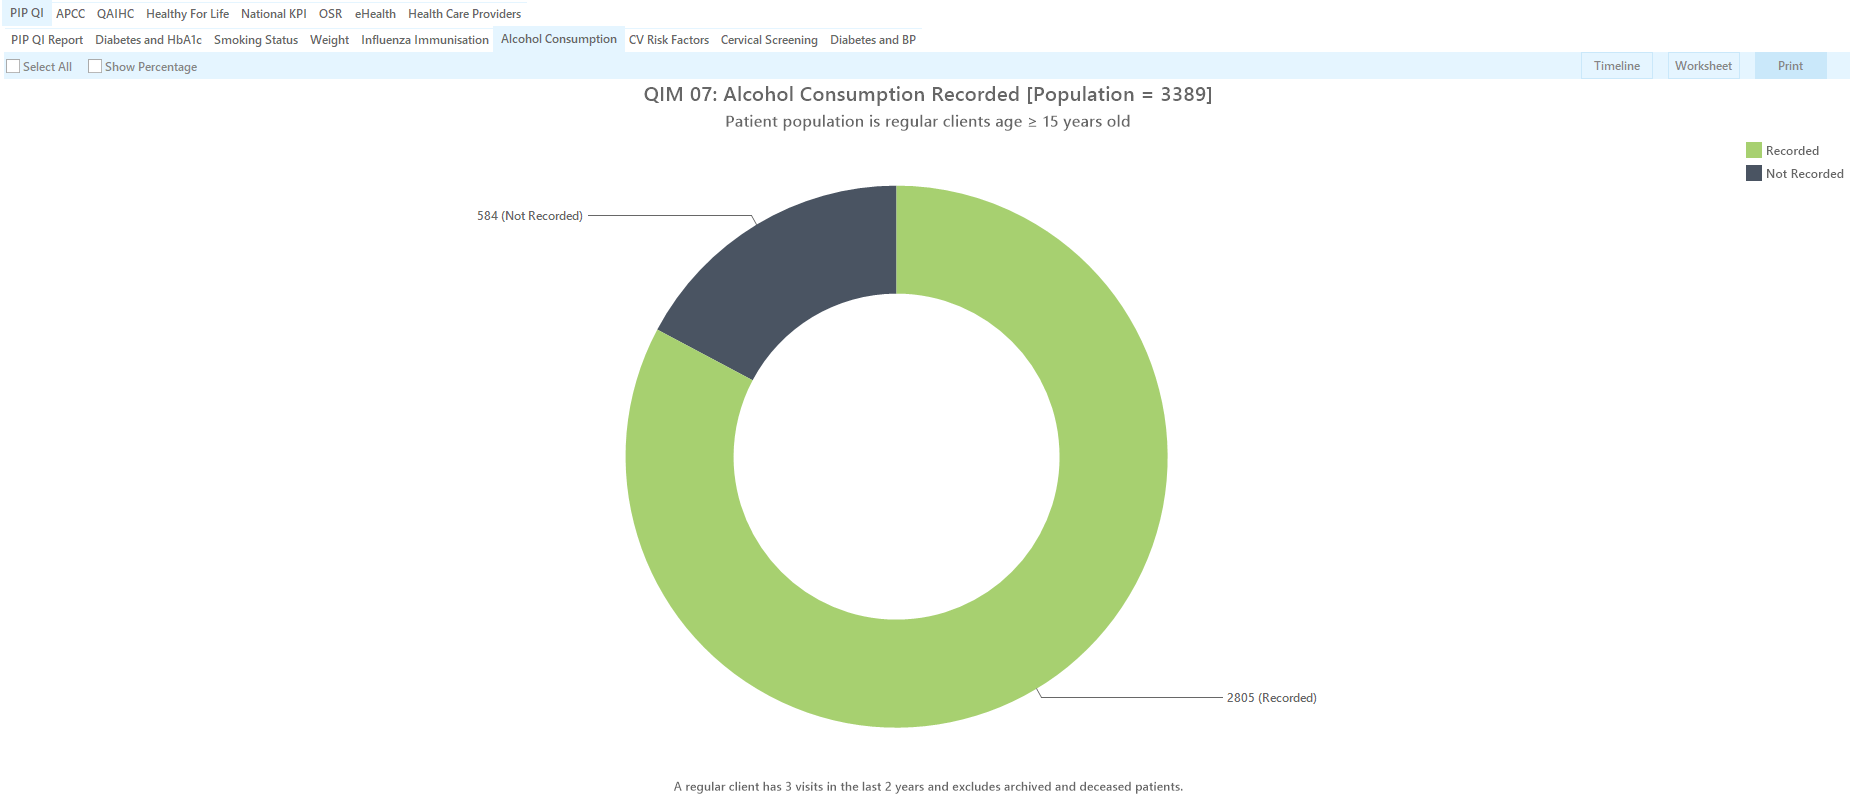
QIM07: Alcohol
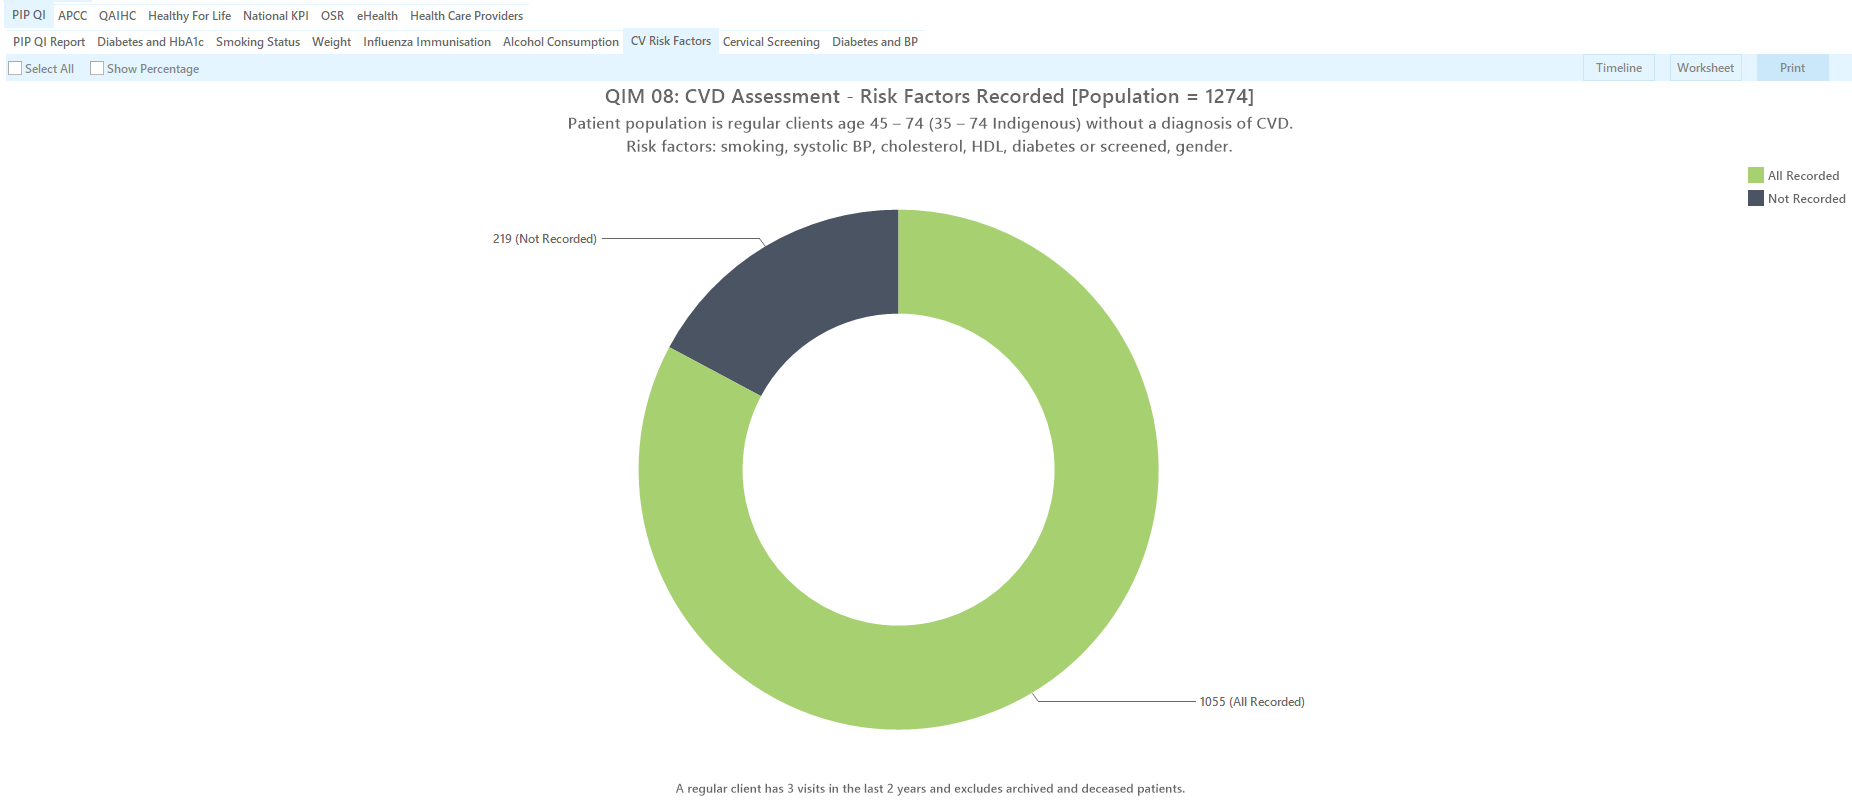
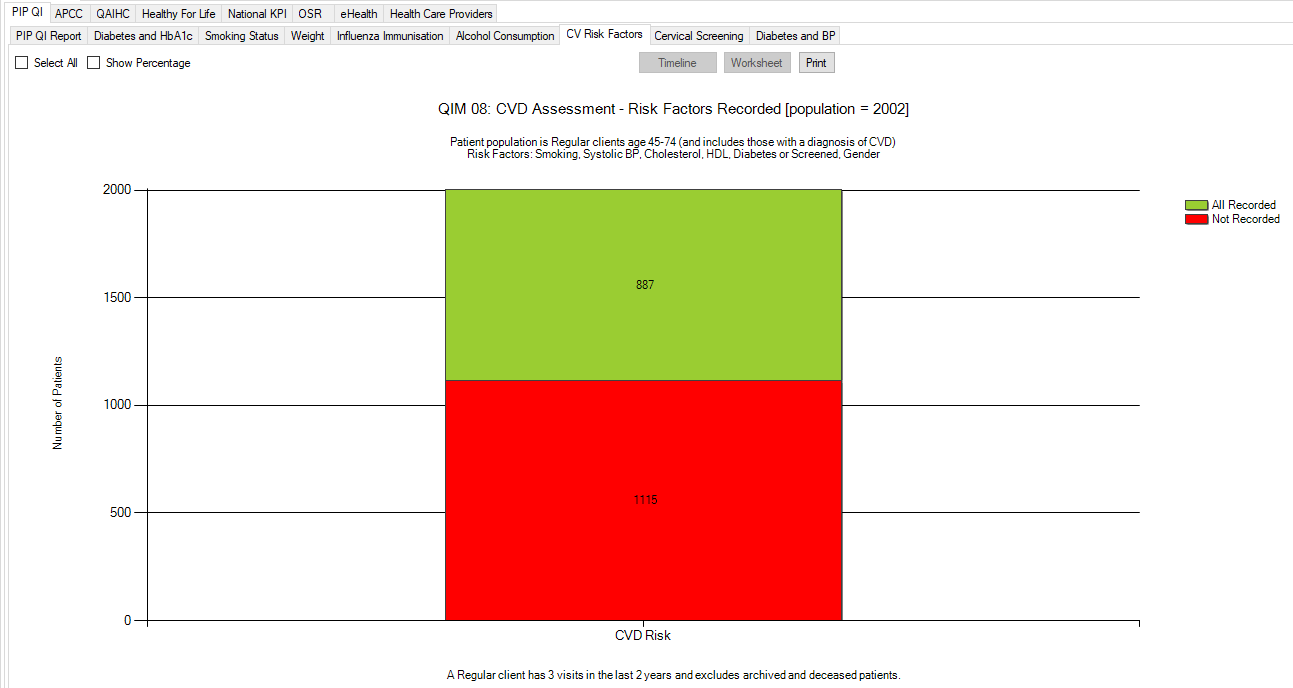
QIM08: CV Risk Factors
This report using the following criteria provided by the Department of Health:
Proportion of regular clients aged 45 to 74 years, who have had all of the following information recorded:
- Tobacco smoking
- Diabetes
- Diabetes status: Type 1 or Type 2 Diabetes OR
- Diabetes risk: Fasting Glucose Test result, or a screening for glycosylated haemoglobin (HbA1c test result)
- Systolic blood pressure
- Total cholesterol and HDL cholesterol levels
- Age
- Sex
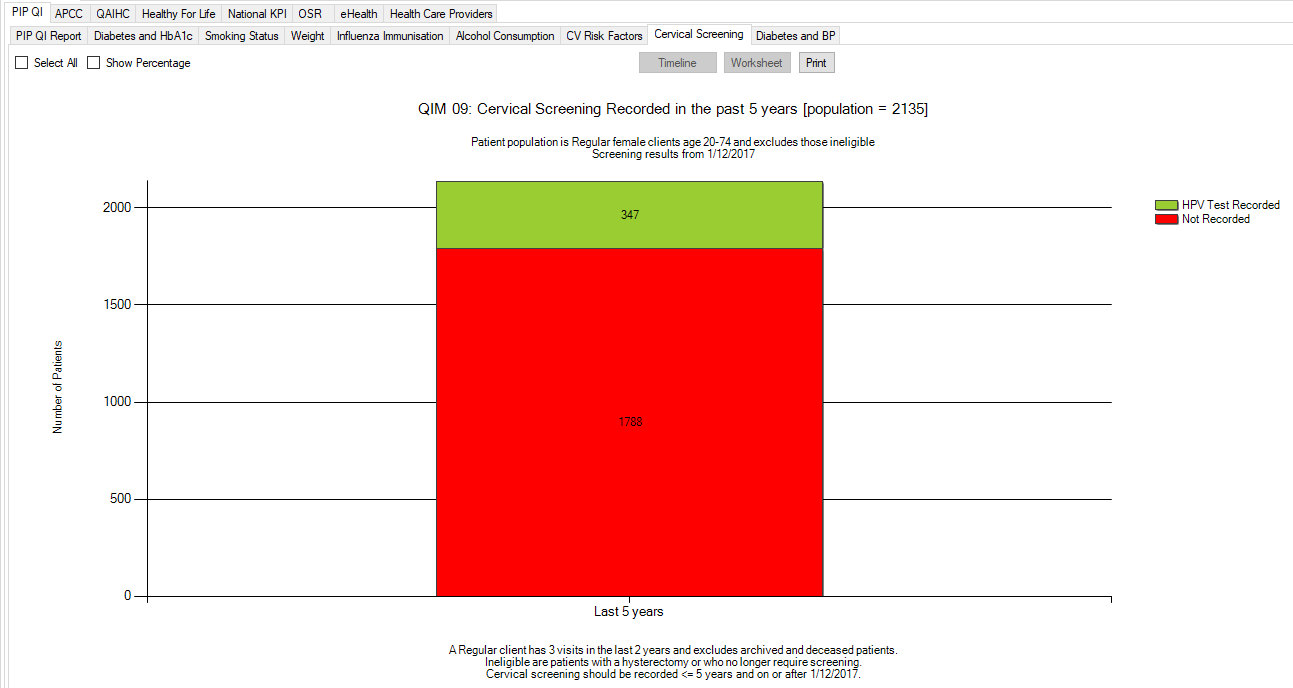
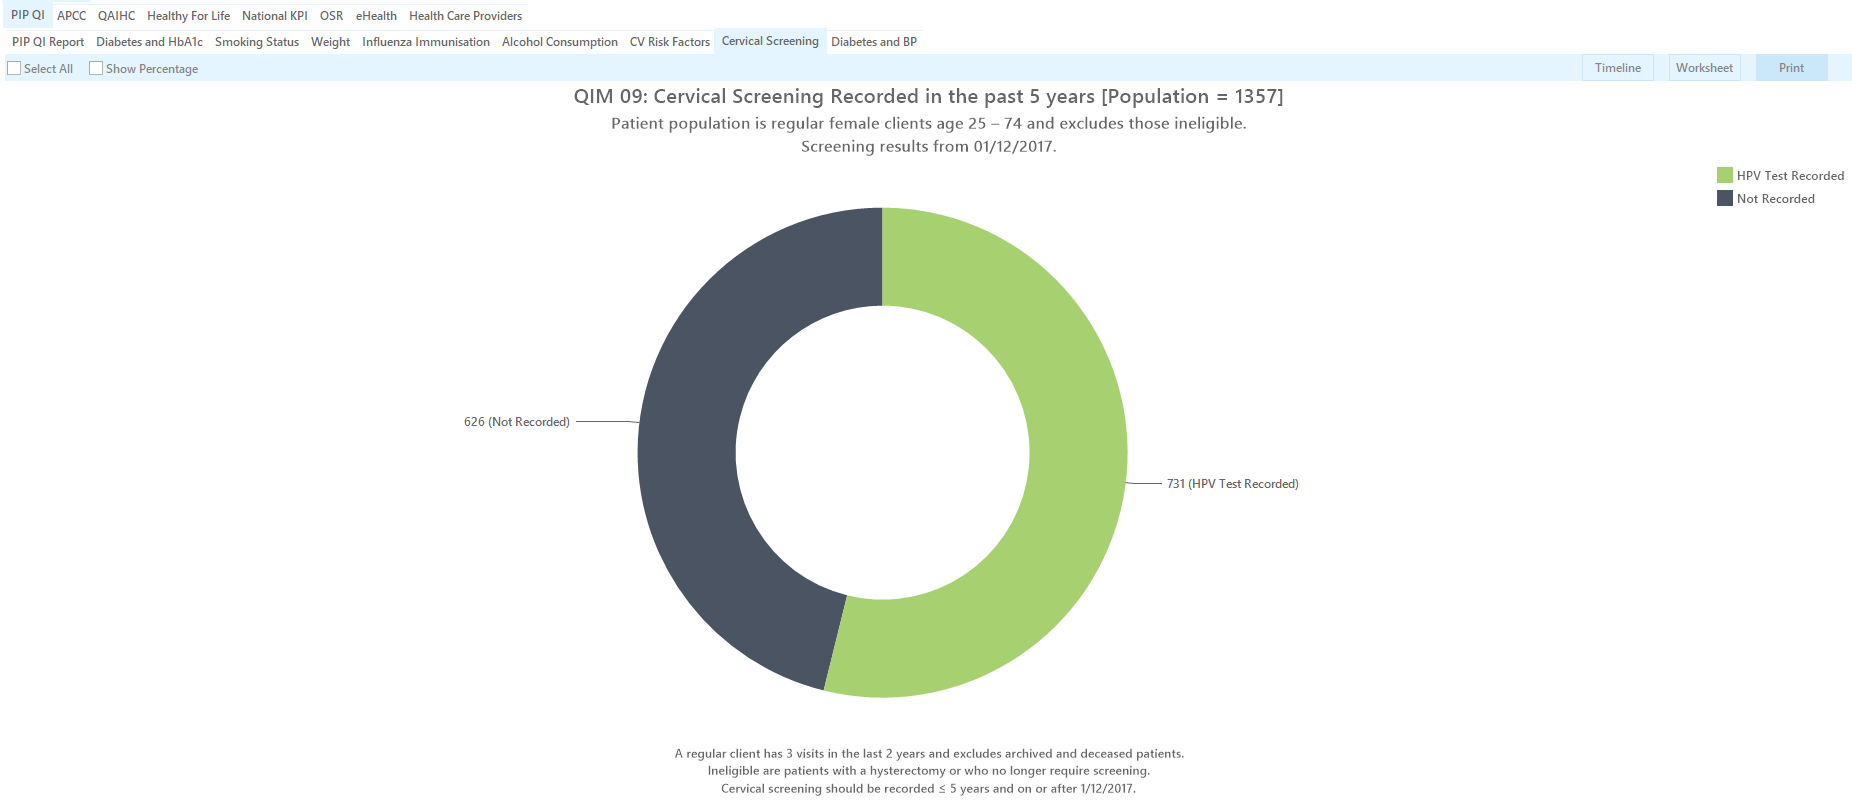
QIM09: Cervical Screening
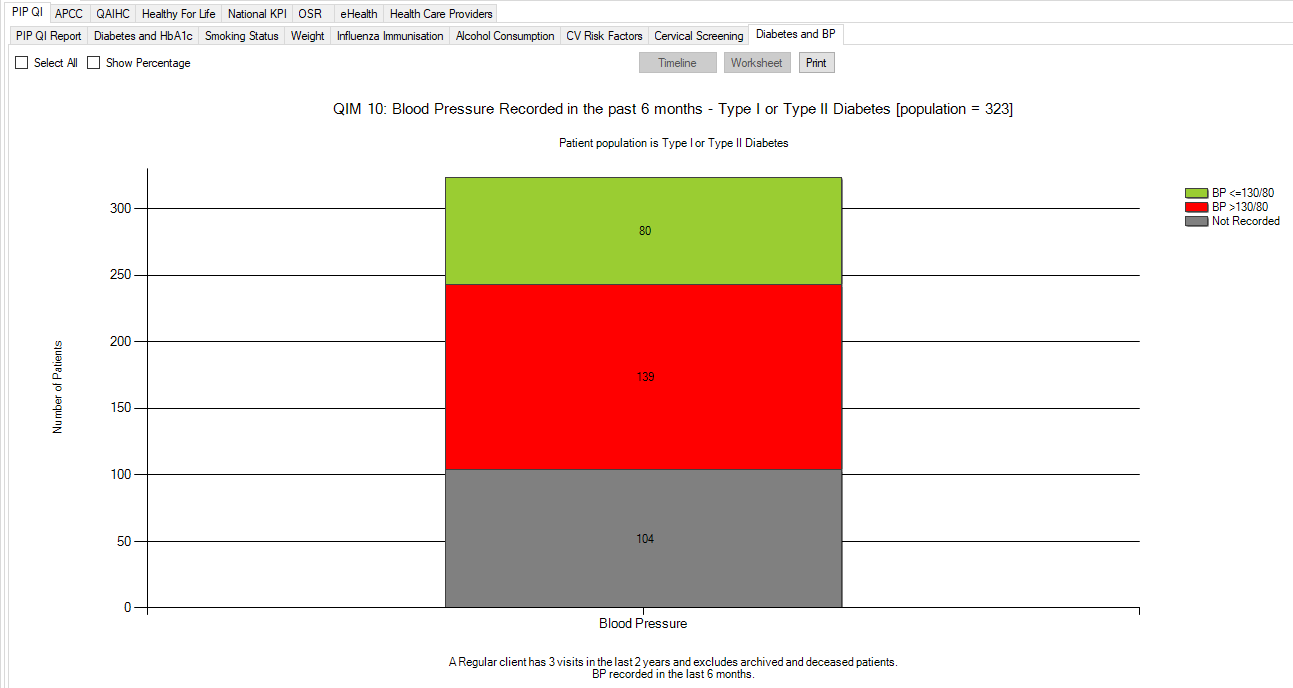
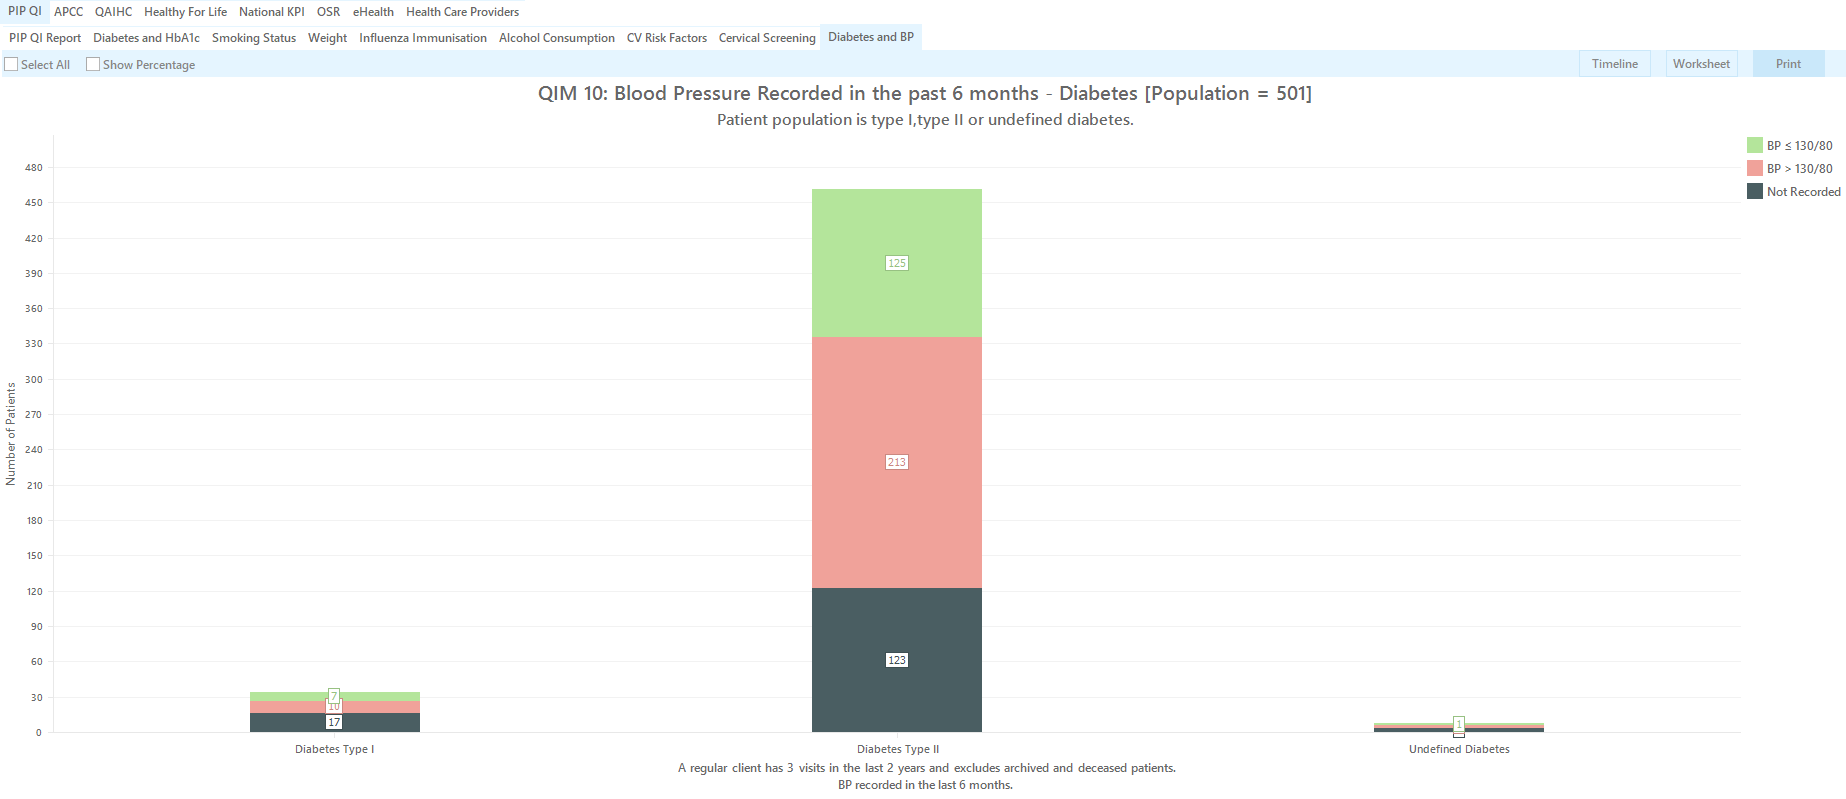
QIM10: Diabetes and Blood Pressure