There are two reports under this tab – the Last Visit and the Contacts by OSR Worker Type.
The Last Visits tab shows a pie chart with the number of visits grouped by <6 months, 6 - <12 months, 12 - <15 months, 15 - <24 months, 24 - <30 months, 30 - <36 months, >= 36 months and Nothing Recorded.
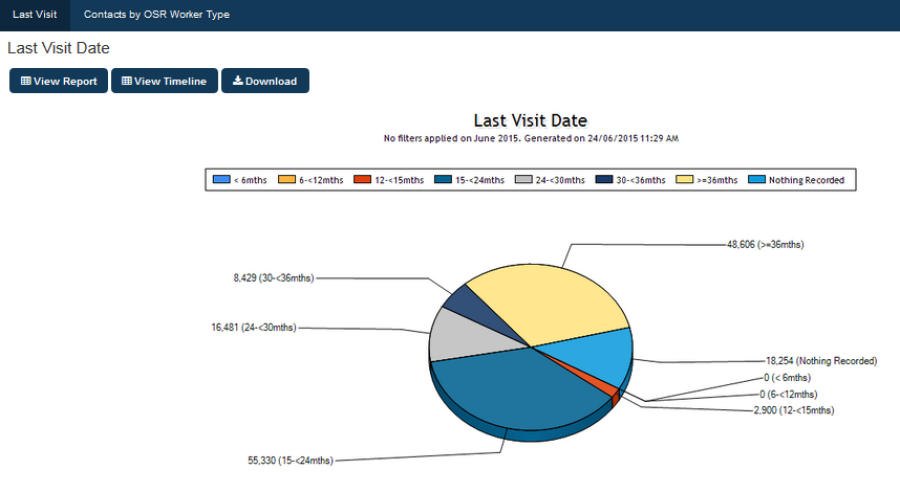
Figure 115: Last Visit Date Chart
The Contacts by OSR Worker Type shows the number of contacts (a contact is defined as a contact with a service provider and during a visit to a clinic multiple contacts are possible, e.g. a client is seen by a nurse and a doctor during a visit.
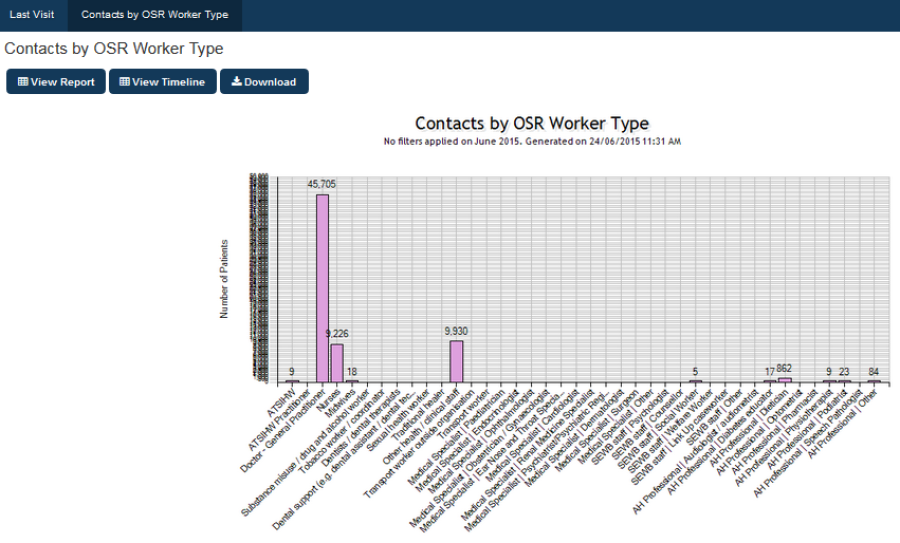
Figure 116: Contacts by OSR Worker Type