The graph provides information on a number of MBS items claimed by the practices. The data is displayed as a bar graph of:
- Count of MBS items recorded
- Count of MBS items not recorded
NOTE: You have to use the Results filter to find MBS items that have been billed in a specific time period.
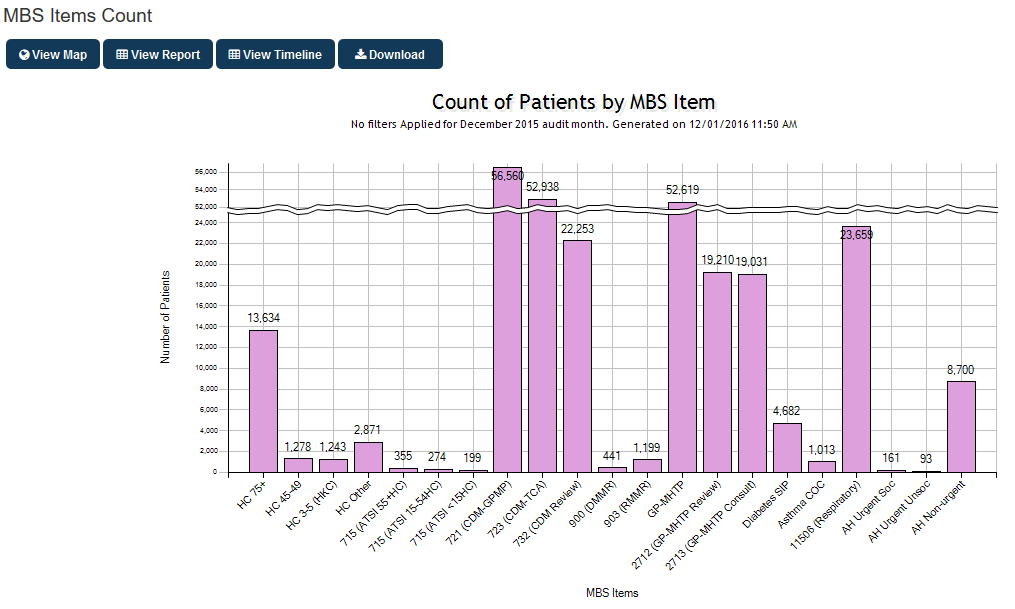
Figure 114: MBS Items Chart