Page History
...
The data is displayed in a pie chart and lists patients with 1, 2, 3, 4 and more than 4 conditions. When part of the graph is selected, the 'Worksheet' button in the top right corner provides patient details and which conditions they have been diagnosed with.
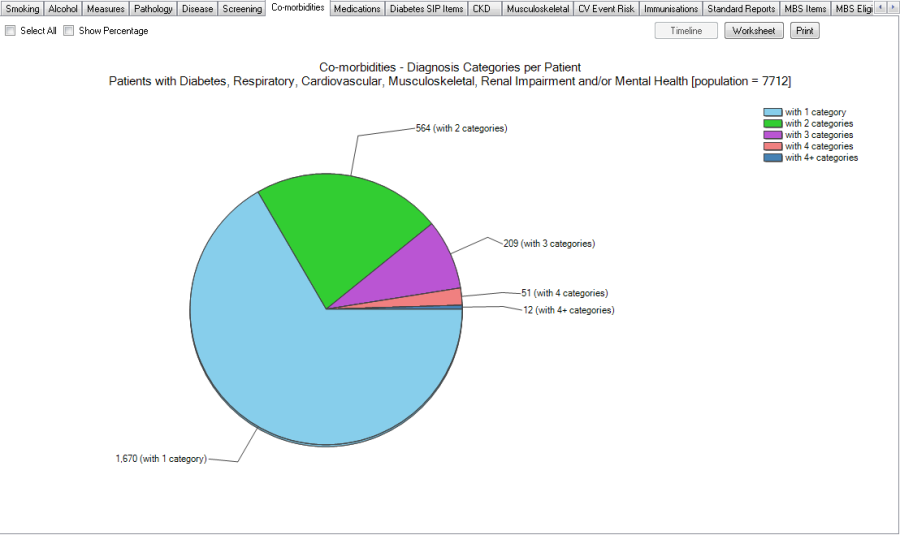
Figure 53: Co-morbidities Pie Chart 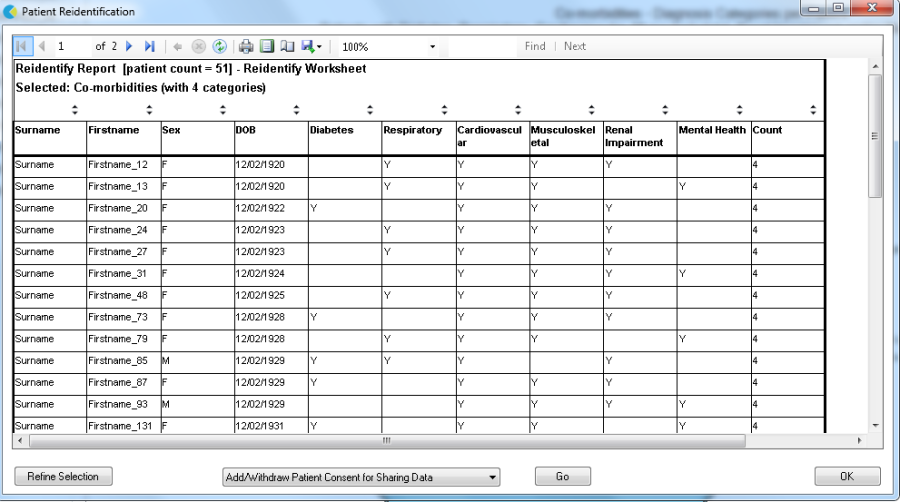
Figure 54: CAT4 Co-morbidities Worksheet
This report uses the same rules for disease mapping as the 'Disease' report.