Page History
...
- =<10%
- >10% to =<20%
- >20% to =<30%
- >40% to =<50%
- >50%
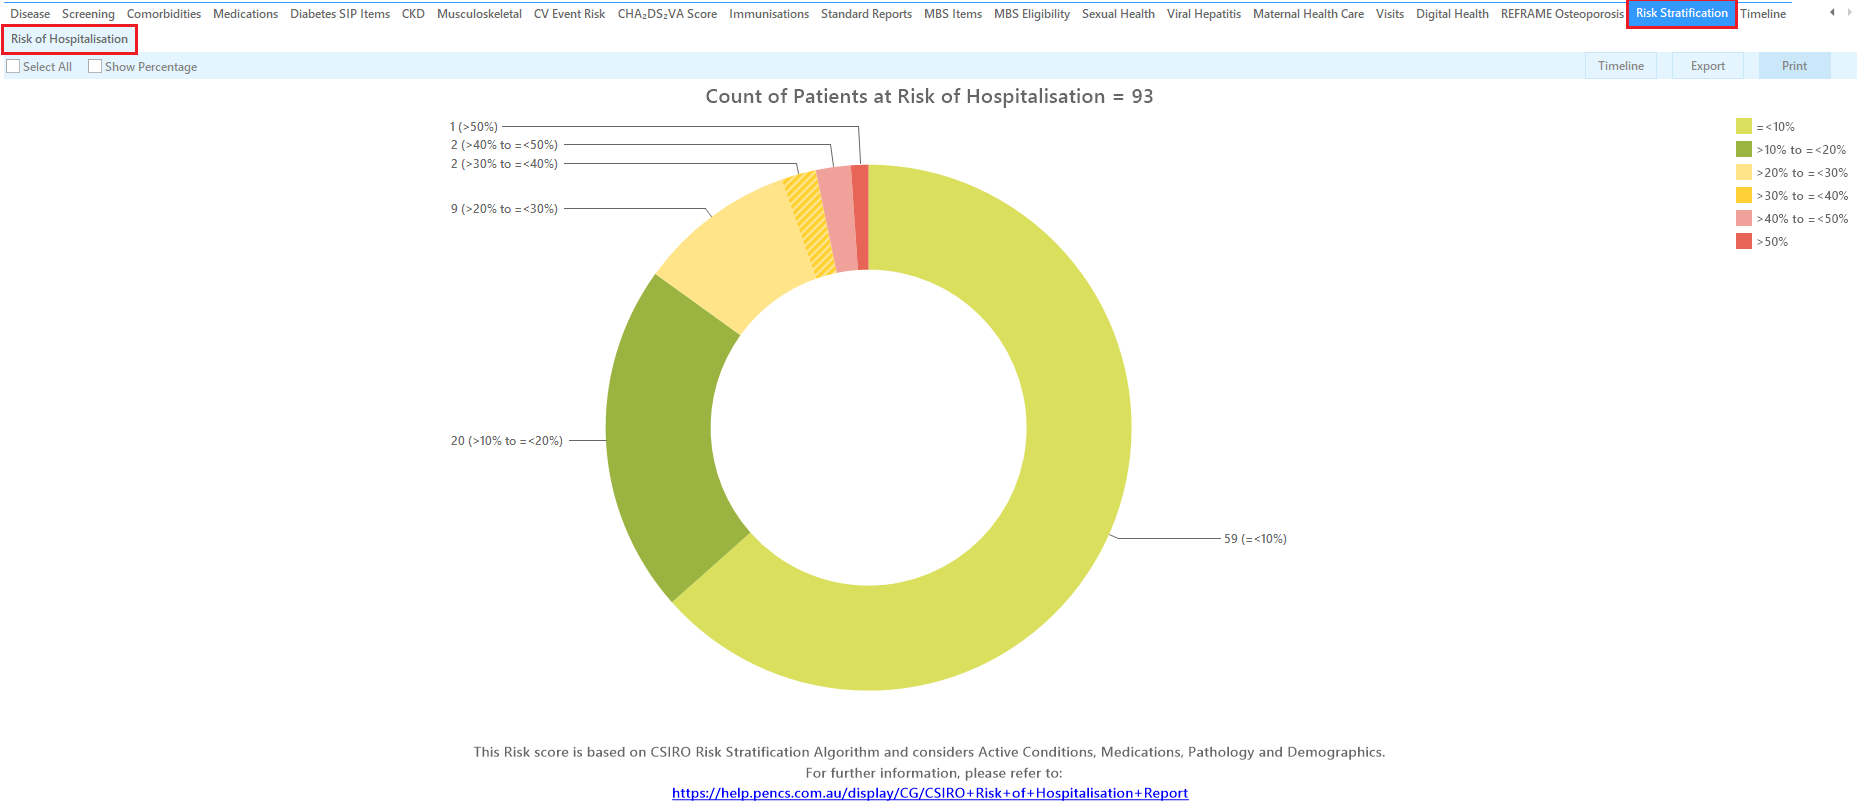
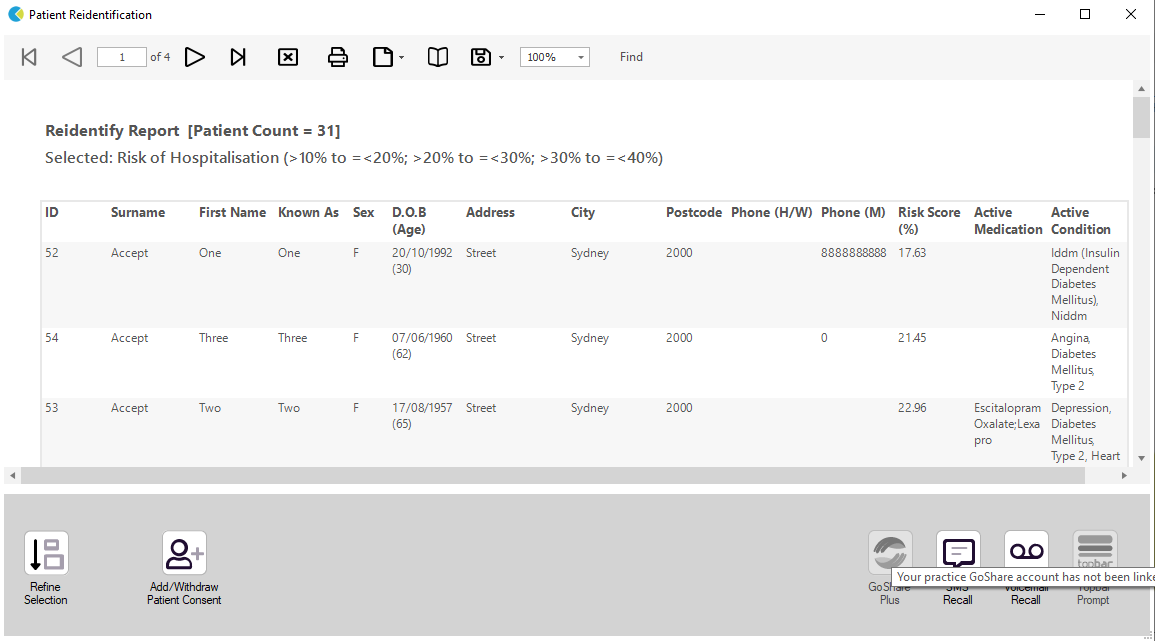
To reidentify patients from any of the ranges mentioned above click the section in the pie chart and click export. Patient Reidentification will show the following details of the selected patient population.
- ID
- Surname
- First Name
- Known As
- Sex
- Age
- Address
- City
- Postcode
- Phone (H/W)
- Risk Score (%)
- Active Medication
- Active Condition
Reference: