Page History
...
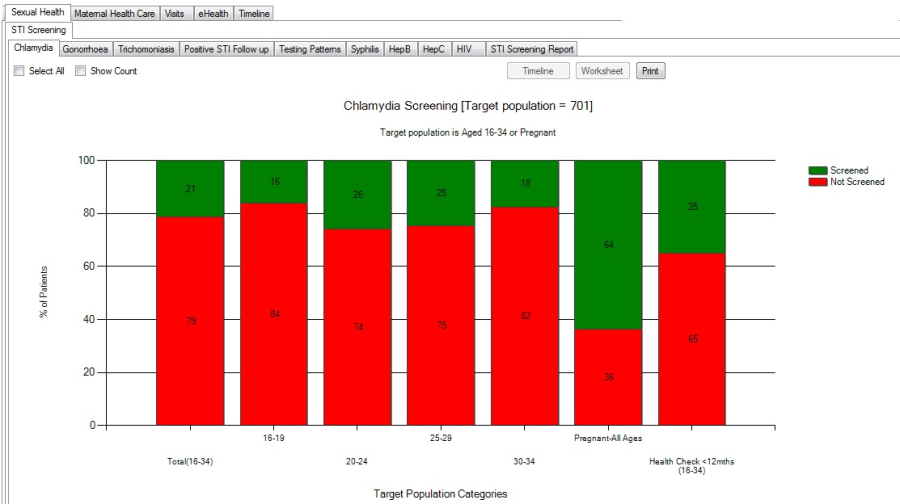
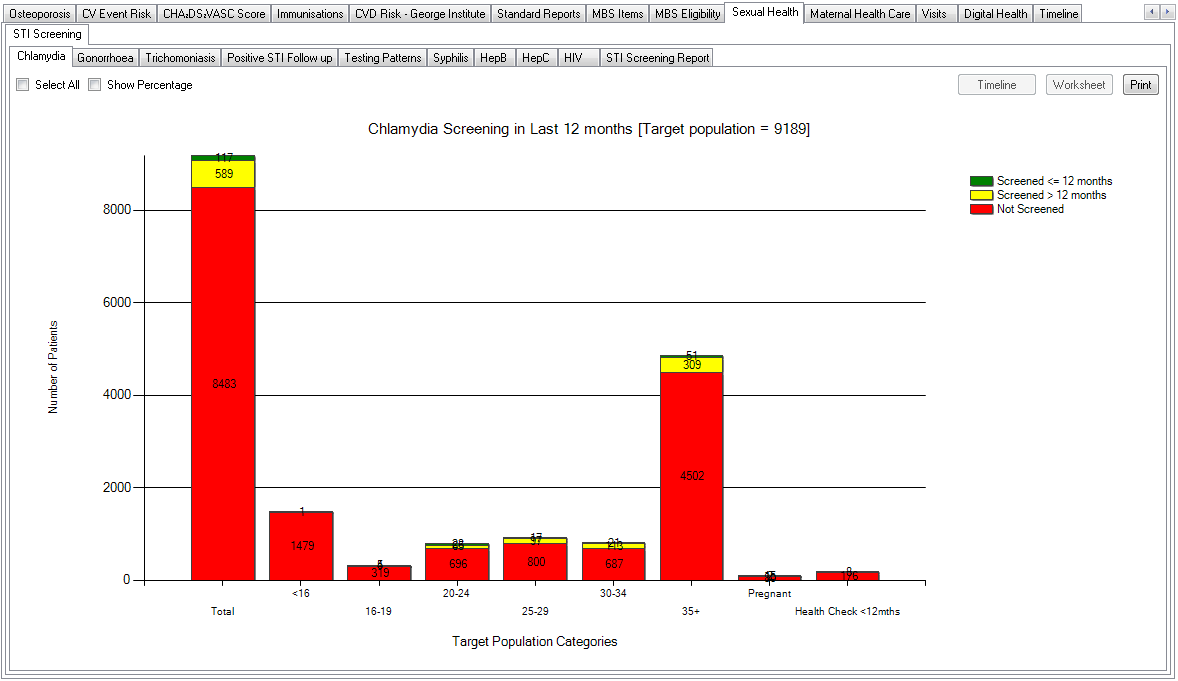
The Screening graphs for Chlamydia, Gonorrhoea and Trichomoniasis display the % patients screened. It can be filtered using the standard filters in CAT4 to display the target population of interest and will show a breakdown by age groups.
the last 12 months for the target population of ages 16-34 or pregnant. Each graph provides a breakdown by
- Age ranges
- Screened in the last 12 months
- Screened more than 12 months ago
- Pregnant
- Patients with a Health Check in the last 12 months
You can toggle between the % patients and the number of patients by checking/unchecking the 'Show Count' tick box.
Select segments of the graph and click the 'Worksheet' button to re-identify patients and review the screening dates.
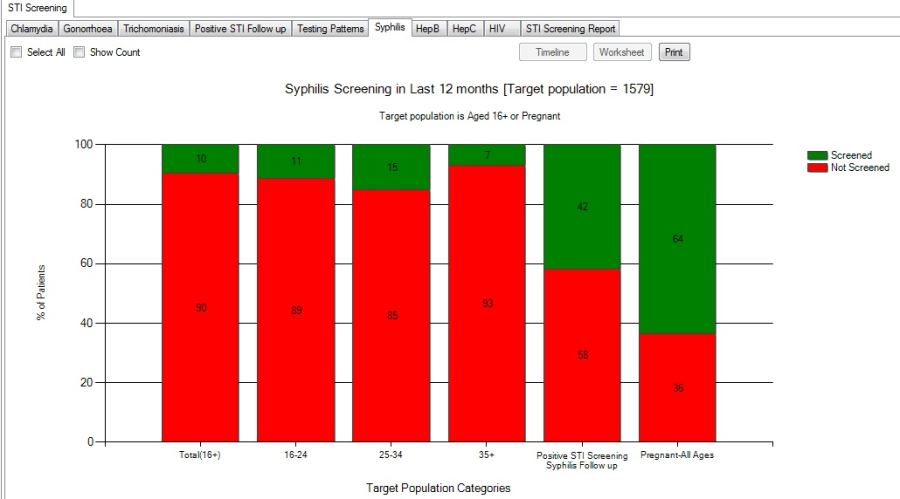
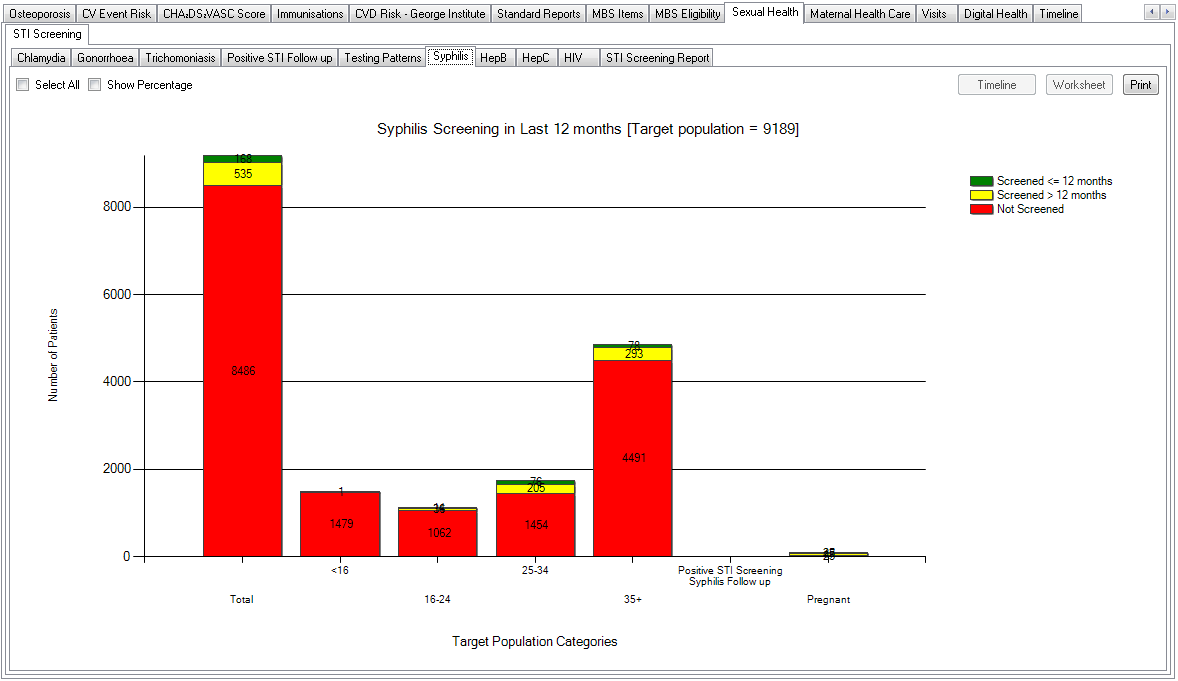
Syphilis, HepB, HepC and HIV
The Screening graphs for Syphilis, HepB, HepC and HIV display display the % patients screened in the last 12 months for . It can be filtered using the standard filters in CAT4 to display the target population of ages 16-34 or pregnant. interest and will show a breakdown by age groups.
Each graph provides a breakdown by
- Age ranges
- Screened in the last 12 months
- Screened more than 12 months ago
- Positive STI screening > [this BBV/STI only] follow up
- where there is a positive test for chlamydia/gonorrhoea/trich, the number of patients then screened fir this BBV/STI
- Pregnant
You can toggle between the % patients and the number of patients by checking/unchecking the 'Show Count' tick box.
Select segments of the graph and click the 'Worksheet' button to reidentify patients and review the screening and follow up dates.
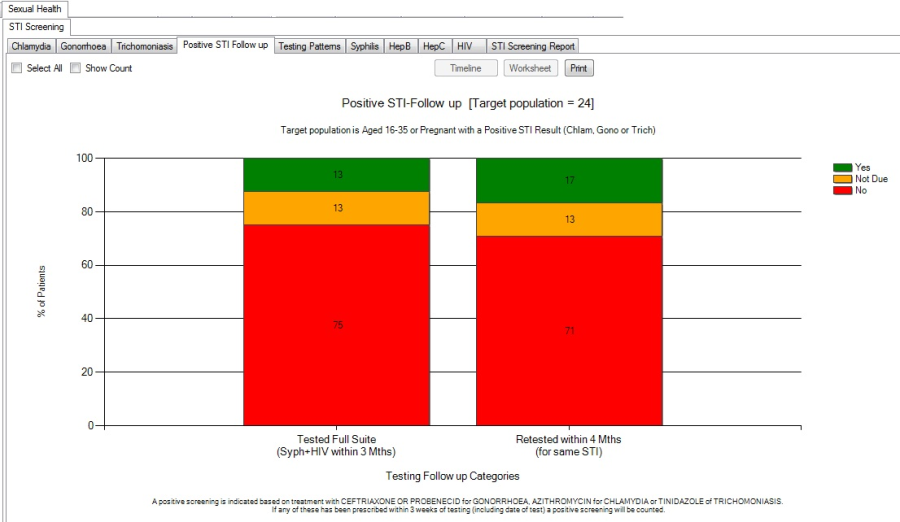
Positive STI Follow up
The Positive STI Follow up graph display % patients screened in the last 12 months that have returned a positive STI test result (for Chlamydia, Gonorrhoea orTrichomoniasis) for . It can be filtered using the standard filters in CAT4 to display the target population of ages 16-34 or pregnantinterest and will show a breakdown by age groups.
Each graph provides a breakdown by
. The graph displays the amount of follow up testing for
...
You can toggle between the % patients and the number of patients by checking/unchecking the 'Show Count' tick box.
Select segments of the graph and click the 'Worksheet' button to reidentify patients and review the screening and treatment dates.
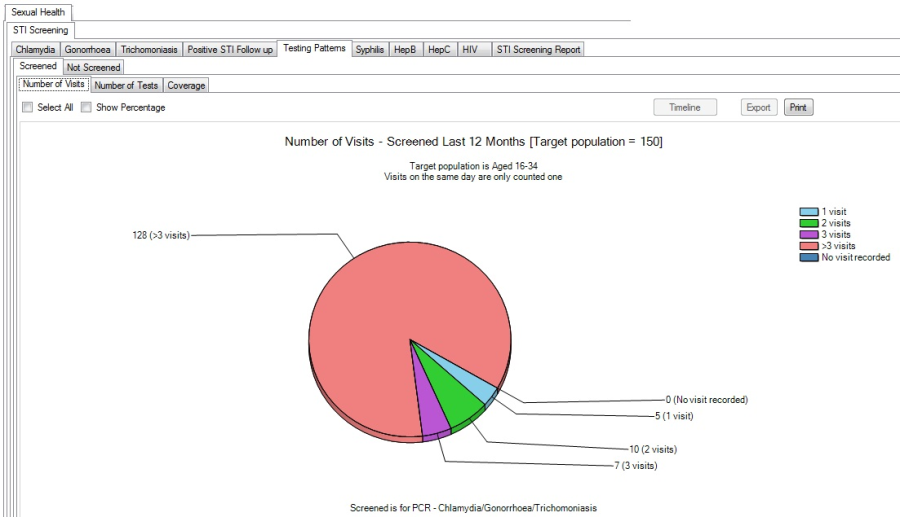
Testing Patterns
The Testing Patterns graphs display activity around screening for the target population of ages 16-34. Separate graphs are provided for
- Screened –
- number of visits
- number of tests
- coverage of tests (Chlaymydia, Chlamydia + Gonorrhoea, Chlamydia + Gonorrhoea + Trichomoniasis)
- Not Screened – number of visits
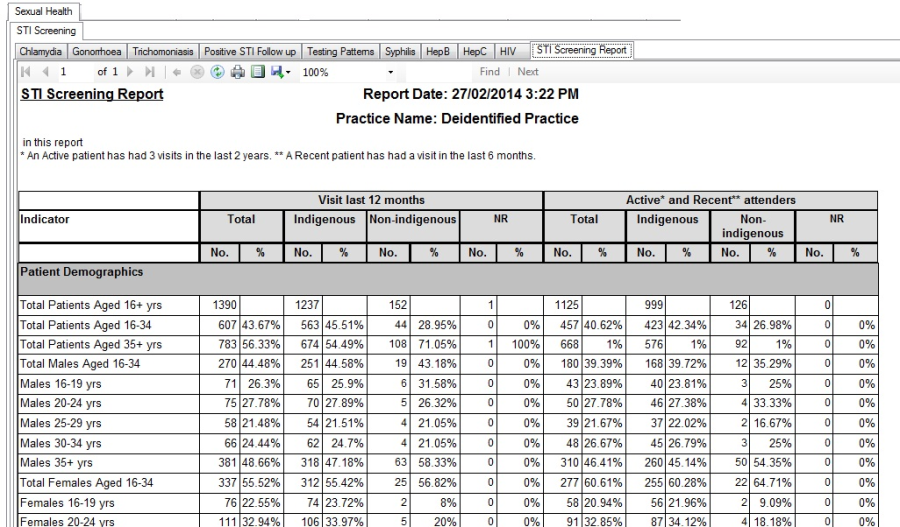
STI Screening Report
The Screening Report provides a report view of all the graphical data that can be exported to Excel for further data analysis.