Page History
...
Each graph provides a breakdown by
. The graph displays the amount of follow up testing for
- Full Suite: Syphilis and HIV within 3 months of the positive result
- Retesting: the same STI within 4 months of treatment
...
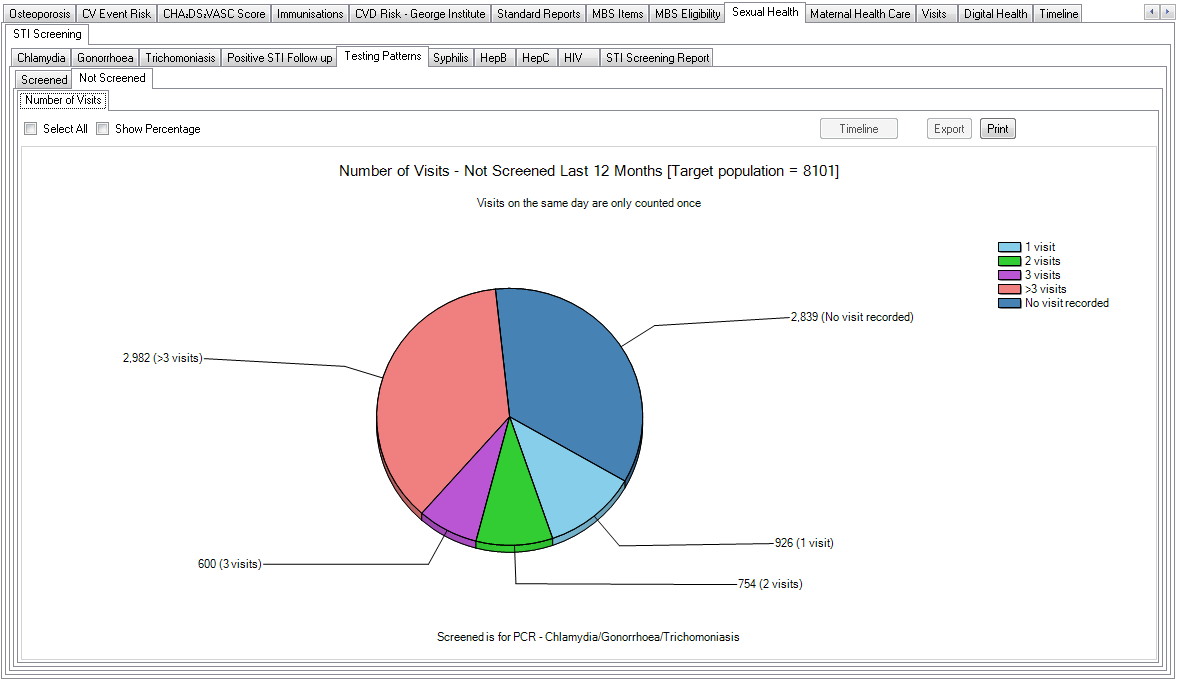
- Screened –
- number of visits
- number of tests
- coverage of tests (Chlaymydia, Chlamydia + Gonorrhoea, Chlamydia + Gonorrhoea + Trichomoniasis)
- Not Screened – number of visits
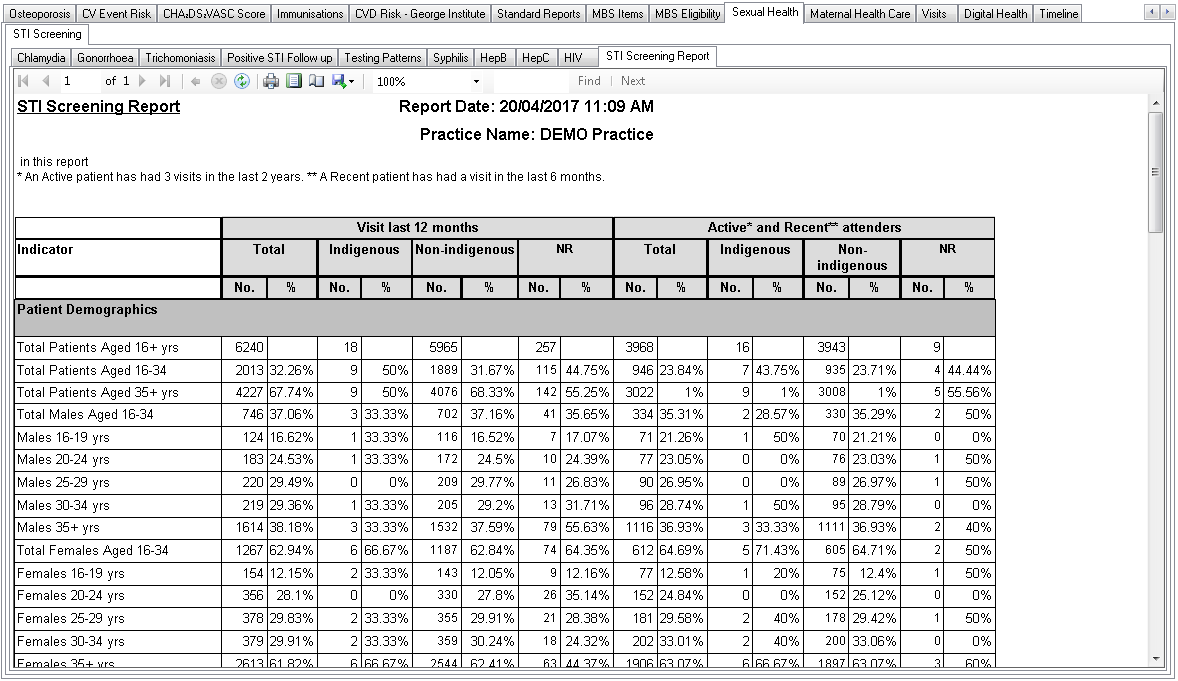
STI Screening Report
The Screening Report provides a report view of all the graphical data that can be exported to Excel for further data analysis.