Overview | The CDSA Tool has been developed to report on the completeness of patient demographic and health summary data within the general practice clinical system. It provides the following reports: - 'Data Quality Dashboard Report' to indicate the overall status of data quality based on the data indicators.
- 'Data Completeness Report' to report the % of completeness for each data indicator.
- 'Data Completeness Patient Graph' to provide a graphical view of the data indicators and allow re-identification of patients where data is missing.
- 'Duplicate Patients Report' to list patient records within the clinical system where duplication is suspected.
| Warning |
|---|
| We provide links to the 4th edition fact sheets because the RACGP has not created fact sheets for the current fifth edition. There has been no change to the details between 4th and 5th editions. |
The CDSA Tool is available in CAT Version 3 for clinical systems where the CAT data extract meets to CAT data specifications version 1_12 or higher. It can be accessed from the CAT4 view under the 'Data Quality' tab. Under that tab are four different tabs which are described in more detail below.
| Warning |
|---|
Please note that the percentages shown on the Data Quality Dashboard are an in some cases an average value of the individual indicators. The Allergies and adverse reaction dashboard is a combination of Allergy Status recorded, Coded Allergy recorded and Reaction Completed. Generally speaking the Data Completeness Report will give much more detail than the dashboard and is the recommended report to understand the data quality dashboard. |
|
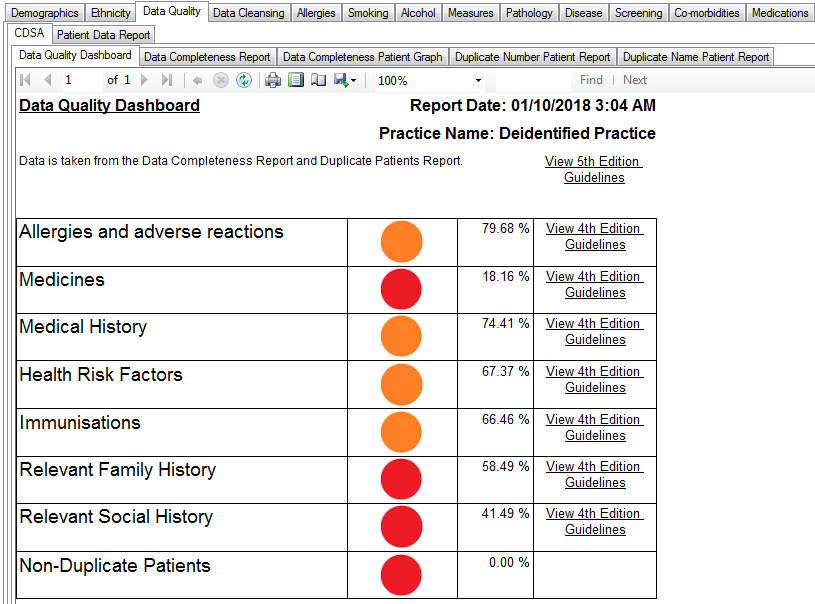 Image Added Image Added
|
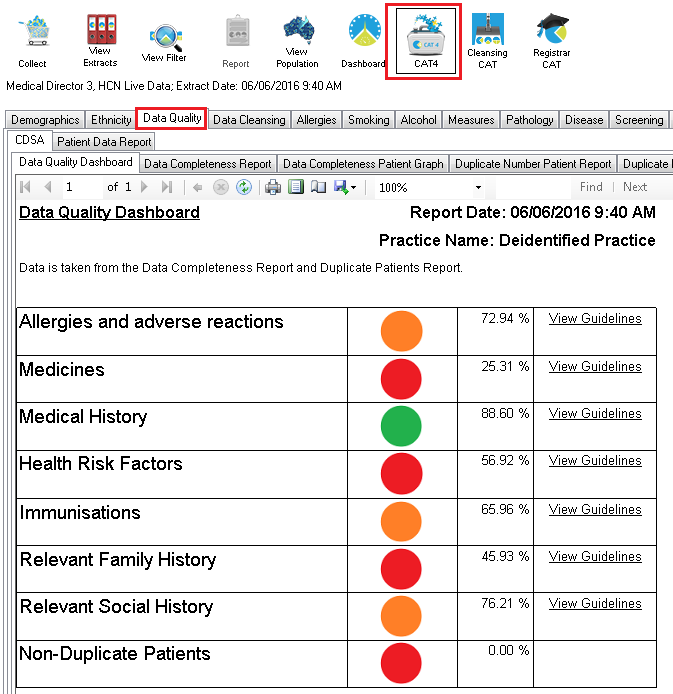 Image Removed
|
Data
Indicators | The data indicators are based on the data content outlined in the RACGP data recommendations http://www.racgp.org.au/ehealth/summary
and are grouped into sections as follows: - Allergies and Adverse Reactions
- Medicines
- Medical History
- Health Risk Factors
- Immunisations
- Relevant Family History
- Relevant Social History
Detailed data indicator information is provided in Appendix A at the end of this guide.
Some indicators may not be available for some clinical systems. These are provided in Appendix B at the end of this guide.
|
Data Quality Dashboard |
|
|
Data Quality
> Dashboard
Report | The Data Quality Dashboard provides a report indicating the overall status of data quality based on the data indicators. It displays each data content section with a 'Traffic Light' status icon
calculated from the % completeness of each data indicator within the section. Each indicator contributes equal weight to the overall status Indicators that are not available for a clinical system do not contribute to the overall status.
.
The 'Traffic Light' status icons will display:
RED : 0 – 60% for all
ORANGE : > 60 – |
85%90% for allergies, >60 - 75% for the other indicators
GREEN : > |
85%90% for allergies, >75% for the other indicators
An additional section for 'Duplicate Patients' is included. The dashboard status for this section is calculated as the percentage of patients where no potential duplication exists.
Note: There will always be some potential duplication that is not an error but with a 'clean' database this should be small and the status icon should be green.
The Data Quality Dashboard provides links to the relevant RACGP fact sheets which provide information on addressing identified gaps and improving overall clinical data quality. |
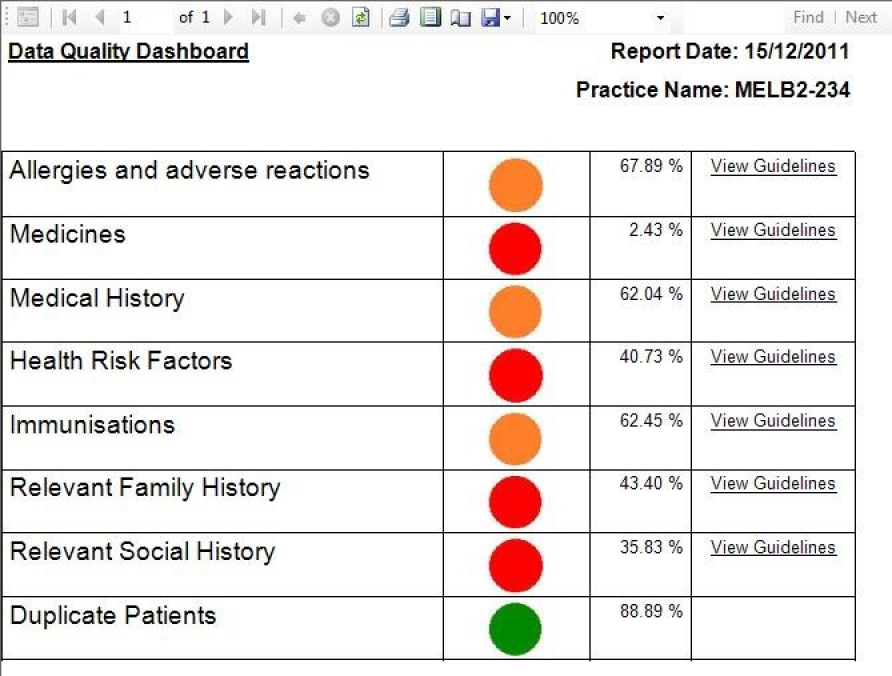 Image Removed
The RACGP has not published updated fact sheets for the 5th Edition of their guidelines, but the recommendations have not changed.
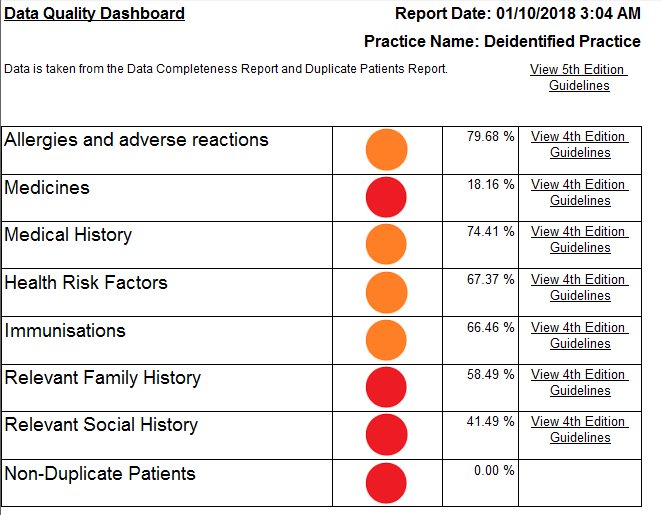 Image Added Image Added
|
Data Completeness Reports |
|
|
Data Quality
> Data
Completeness
Report | The Completeness Report provides a % of completeness for each data indicator.
For each data indicator the report displays:
Measure = measure description
Count = the number of data items correctly recorded
Eligible population = the possible number of data items for this measure (the measure denominator)
% = the count as a % of the eligible population
The eligible population is generally Active patients (3 visits in the last 2 years). Where an indicator has a different denominator this is highlighted on the report.
Indicators that are not available for a clinical system are highlighted in the report as 'Not Available'. |
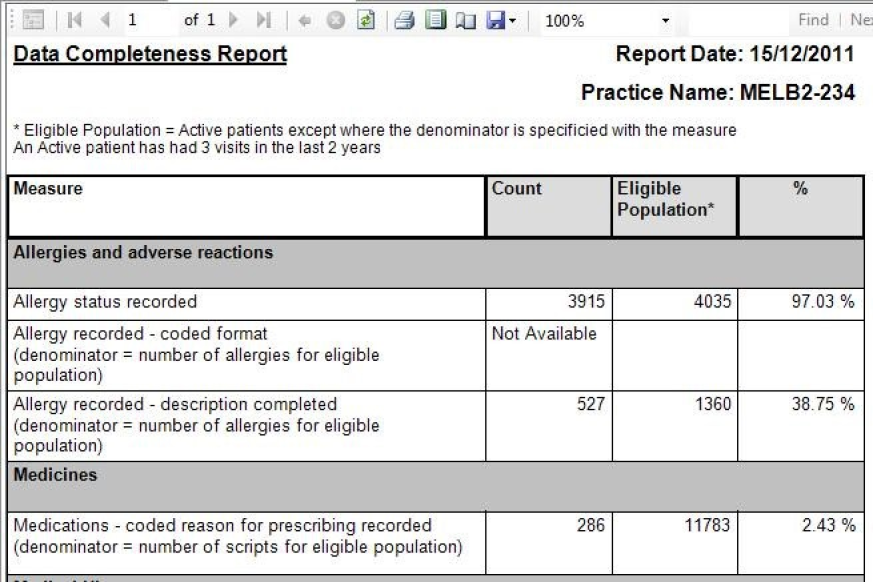 Image Modified Image Modified
|
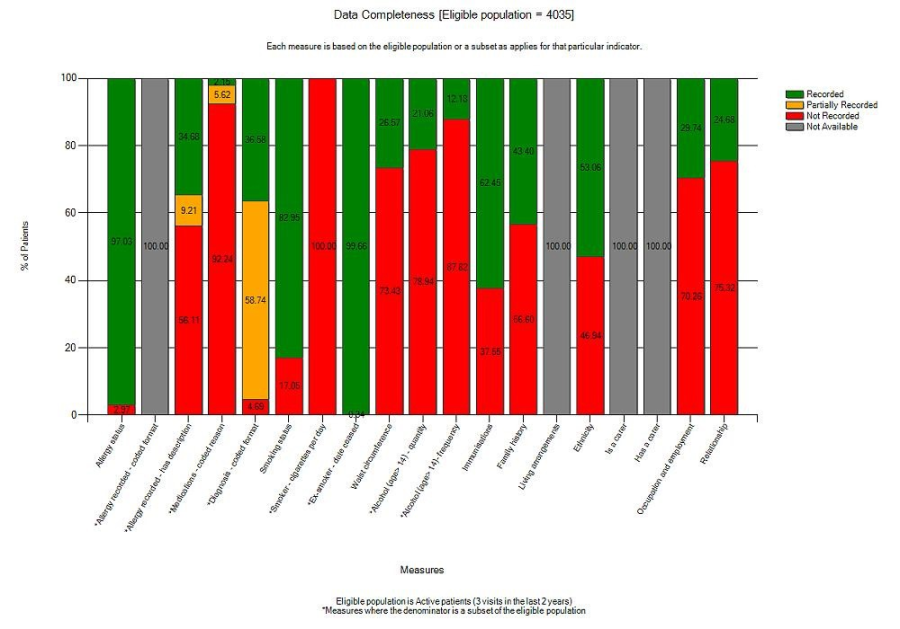 Image Removed
 |
Data Quality
> Data
Completeness
Graph | The Completeness graph provides a graphical view of the data indicators by patient and allows re-identification of patients where data is missing.
For each data indicator the report displays a patient in one of the following categories:
Green = Recorded (all items for this measure are recorded)
Orange = Partially recorded (some items for this measure are recorded)
Red = Not recorded (no items for this measure are recorded)
Grey = Not Available (no items for this measure are available for recording)
The eligible population is the Active patients (3 visits in the last 2 years). Where an indicator has a subset denominator this is highlighted in the report label. |
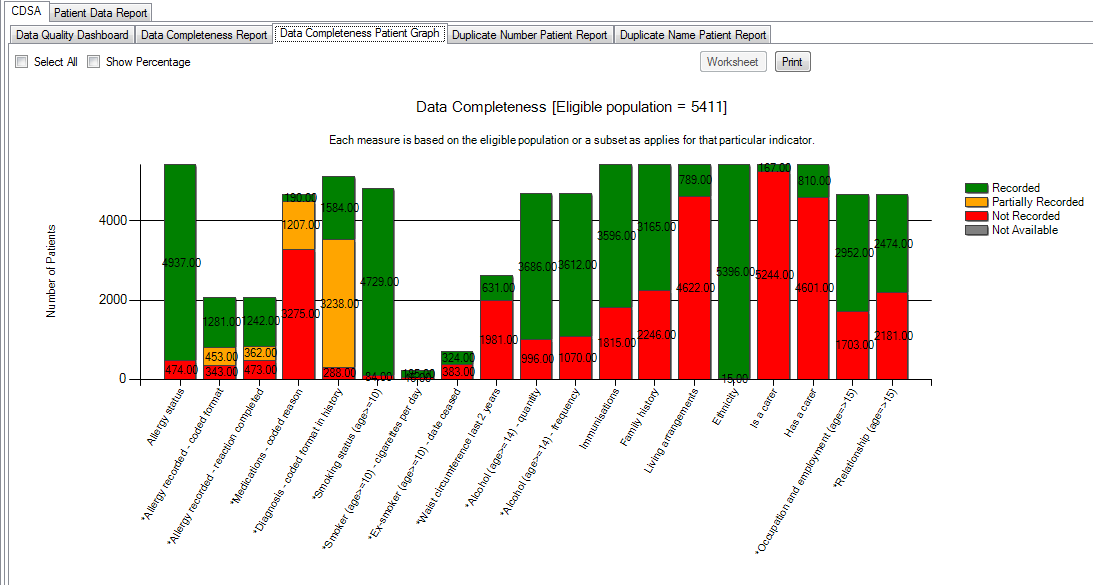 Image Added Image Added
|
|
Data
Completeness
Worksheet | Patient data can be exported from the Data Completeness Graph using the 'Worksheet' button.
The worksheet provides patient demographic details and a summary of the data contributing to each indicator. This allows missing data to be easily identified for follow up.
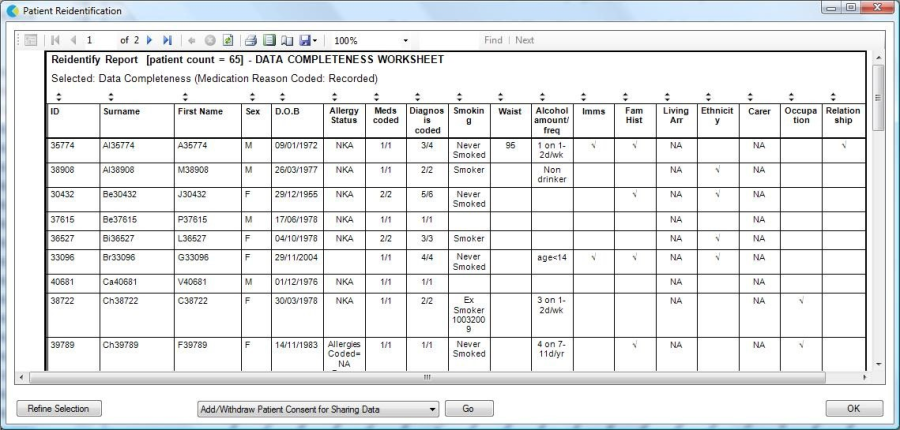 Image Modified Image Modified
|
Duplicate Patients Report |
|
|
Data Quality >
Duplicate
Patients
Report | The Duplicate Patients Report is a list of patient records within the clinical system where duplication is suspected.
The report is divided into 2 parts: - Name match – a match on all of:
Surname, First name initial, Gender and DOB
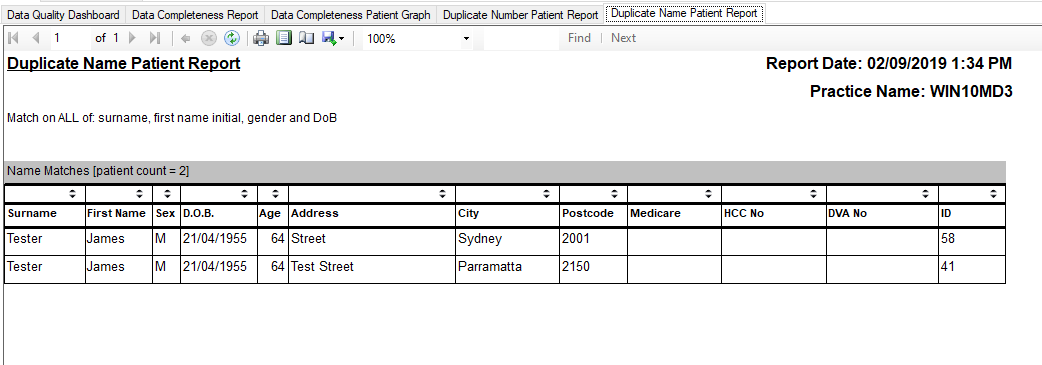 Image Added Image Added
- Number match – a match on any of:
Medicare number Practices may find duplicate Medicare numbers appear if their clinical system CAT extractor is not including the Medicare index number in the full number
HCC number
DVA number
The population is Total Patients.
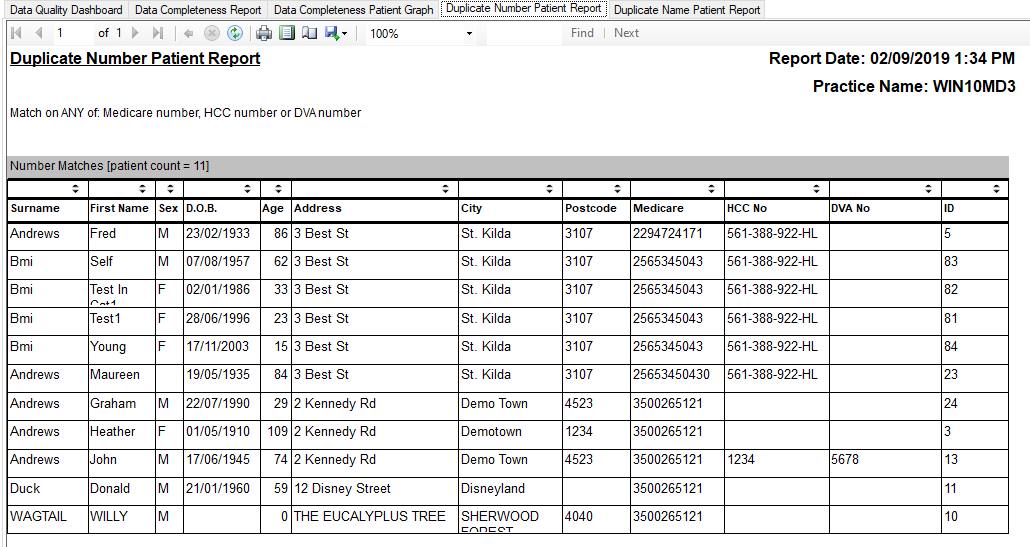 Image Added Image Added
The report can be sorted by any of the columns. The default sorting is:
- Name match by surname then first name
- Number match by Medicare number then surname
|
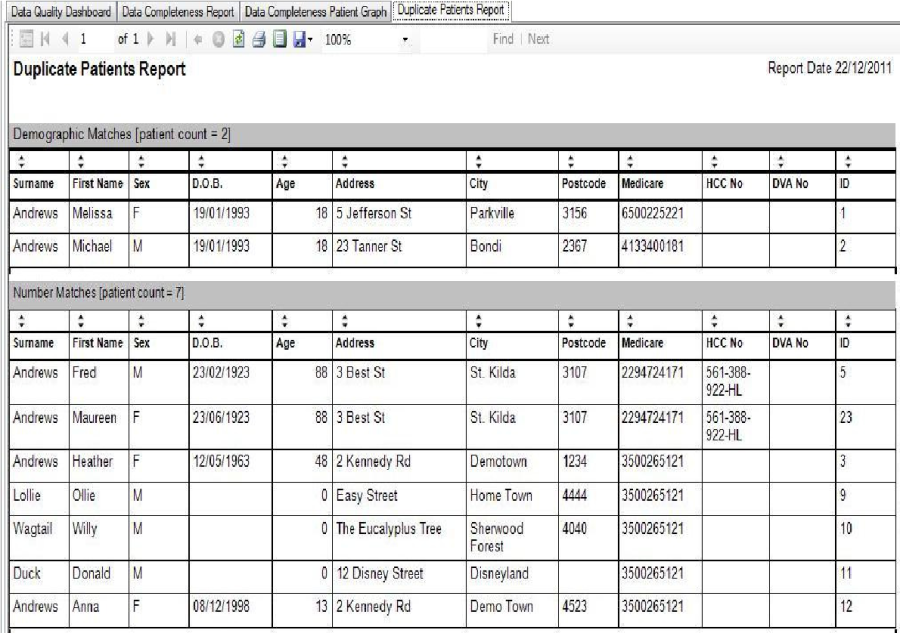 Image Removed
Appendix A: Data Indicators |
|
|
|
Indicator | Numerator | Denominator |
1. Allergies and Adverse Reactions |
| |
|
|
Allergy status recorded | Number of patients with an allergy status recorded
(Allergy recorded or no known allergies) | Active patients |
Allergy recorded – coded format | Number of allergies recorded that are not NKA from a coded table of available allergens | Number of allergies for active patients recorded that are not NKA |
Allergy recorded – reaction completed | Number of allergies recorded that are not NKA that have content in the reaction field | Number of allergies for active patients recorded that are not NKA |
2. Medicines |
| |
|
|
Medications – coded reason for prescribing | Number of prescriptions for current medications in active patients where the reason for prescribing is recorded from a coded pick list | Number of prescriptions for current medications recorded for active patients |
3. Medical History |
| |
|
|
Diagnosis recorded – coded format in past history | Number of diagnoses entered in the past history which have been entered in a coded format | Number of diagnoses recorded in the past history for active patients |
| |
|
|
Smoking status recorded | Number of active patients 10 years and over for whom smoking status is recorded | Active patients 10 years and over |
Smoker – Cigarettes per day recorded | Number of active patients 10 years and over recorded as smokers for whom the number
of cigarettes has been recorded | Active patients 10 years and over recorded as smokers |
Ex-smoker – Date ceased | Number of active patients 10 years and over recorded as ex-smokers for whom a cease
date is recorded | Active patients 10 years and over recorded as ex-smokers |
Waist circumference recorded in overweight/underweight patients | Number of active patients for whom a waist circumference is recorded within the last 2 years | Active patients who are overweight (BMI ≥ 25) or underweight (BMI < 18.5) |
Alcohol Status – quantity recorded | Number of active patients 14 years and over who have alcohol quantity recorded | Active patients 14 years and over |
Alcohol Status – frequency recorded | Number of active patients 14 years and over who have alcohol frequency recorded | Active patients 14 years and over |
5. Immunisations |
| |
|
|
Immunisations recorded Active patients
with immunisations recorded in the system |
|
| Active patients |
6. Relevant Family History |
| |
|
|
Family history recorded | Active patients with family history recorded in the system | Active patients |
7. Relevant Social History |
| |
|
|
Living arrangement recorded | Active patients with living arrangements recorded | Active patients |
Ethnicity recorded | Active patients with ethnicity recorded | Active patients |
Is a carer recorded | Active patients with 'Is carer' recorded | Active patients |
Has a carer recorded | Active patients with 'has a carer' field recorded | Active patients |
Occupation and employment status recorded | Active patients with occupation and employment status field recorded | Active patients 15 years and over |
Relationship status recorded | Active patients with relationship status field recorded | Active patients 15 years and over |
8. Duplicate Patients |
|
|
|
Duplicate Patients | Patients who have a match on any of the following:
Surname, First name initial, Gender and DOB
Medicare number
HCC number
DVA number
A patient is only counted once regardless of the number of items where there are matches | Total Population |
Appendix B: Indicator unavailability by
Clinical System |
|
|
Medical
Director | The following indicators are not available for collection from Medical Director: Allergy recorded – coded format Living arrangement recorded Is a carer recorded
Has a carer recorded |
Best Practice | All indicators are available |
Medinet | The following indicators are not available for collection from Medinet:
Allergy recorded – coded format
Medications – coded reason
Living arrangement recorded Is a carer recorded
Has a carer recorded |