Page History
The Ethnicity tab displays your data as a pie chart with on two tabs:
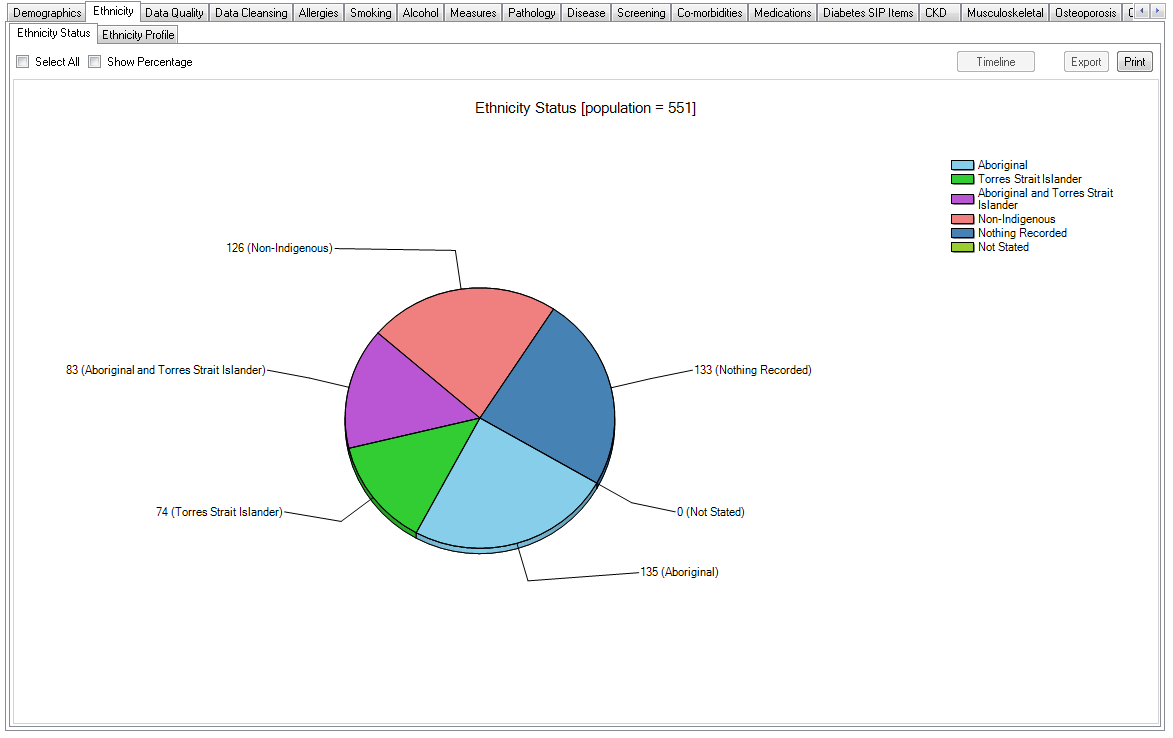
The Ethnicity Status tab shows a breakdown of the patients by their indigenous status and lists the following details:
- Aboriginal
- Torres Strait Islander
- Aboriginal and Torres Strait Islander
- Non-Indigenous
- Nothing Recorded
- Not Stated
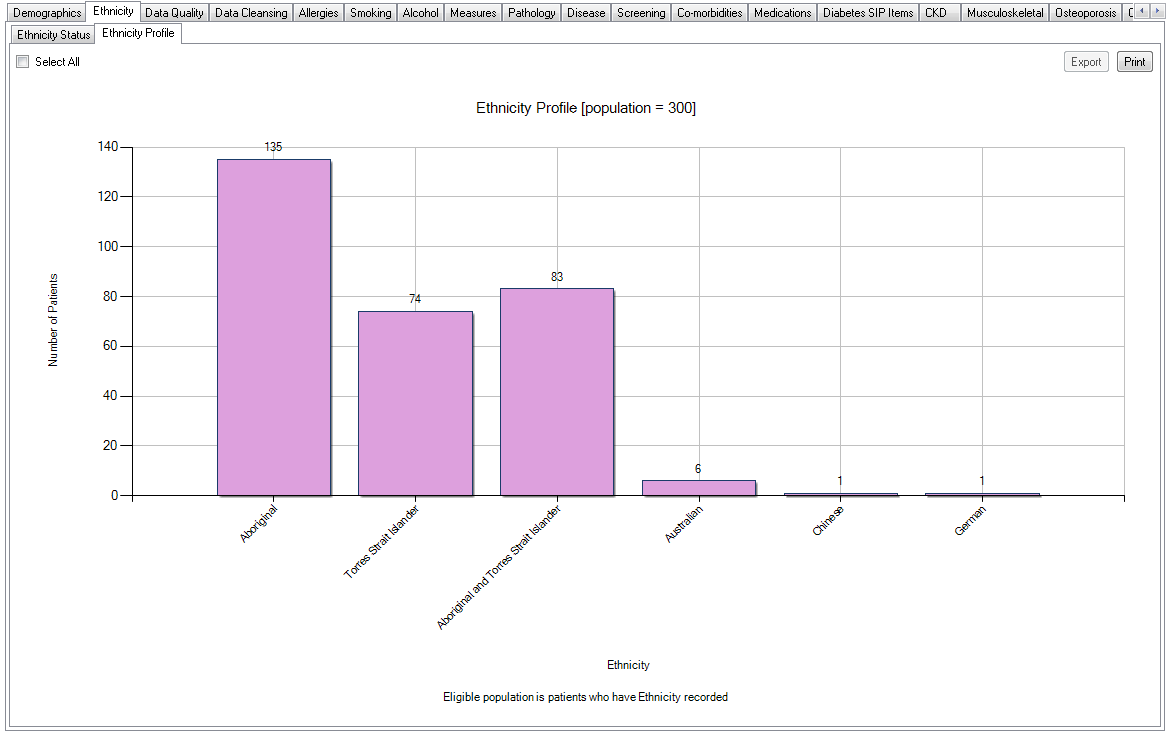
A pie chart (as above) and a bar chart are provided. The Ethnicity Profile bar chart report shows a breakdown of the other shows all countries/ethnicities entered in your clinical system rather than the pie chart with the ethnicity status which only shows the indigenous status. Only the ethnicities entered will be displayedthe patient record and a bar chart of this information.