Page History
...
Each graph provides a breakdown by
. The graph displays the amount of follow up testing for
- Full Suite: Syphilis and HIV within 3 months of the positive result
- Retesting: the same STI within 4 months of treatment
...
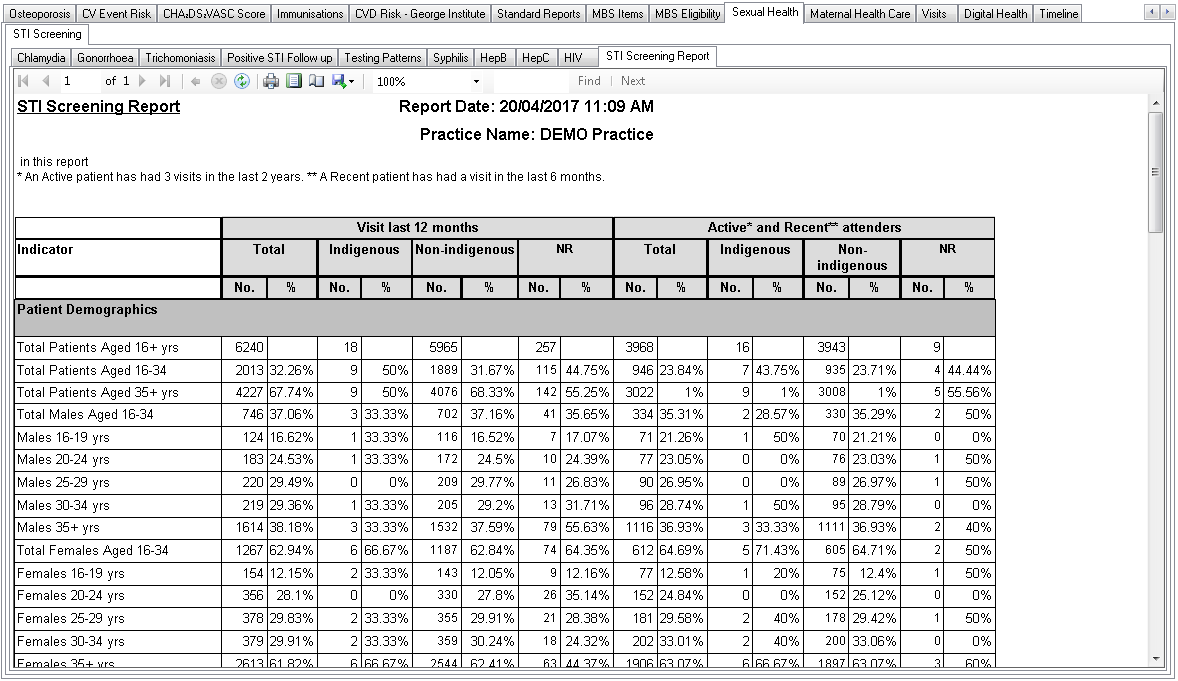
The Screening Report provides a report view of all the graphical data that can be exported to Excel for further data analysis.
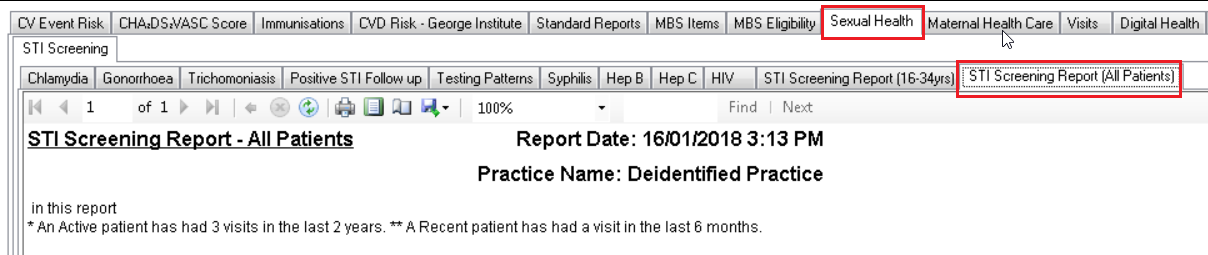
STI Screening For All Patients
This tab provides the same information as the report above but instead of limiting the data to patients of particular age now all patients are shown. Standard filters can be applied to narrow down the population of interest.