Page History
The Immunisation/Adult tab contains two reports, Pertussis and Shingles.
| Children Display | ||
|---|---|---|
|
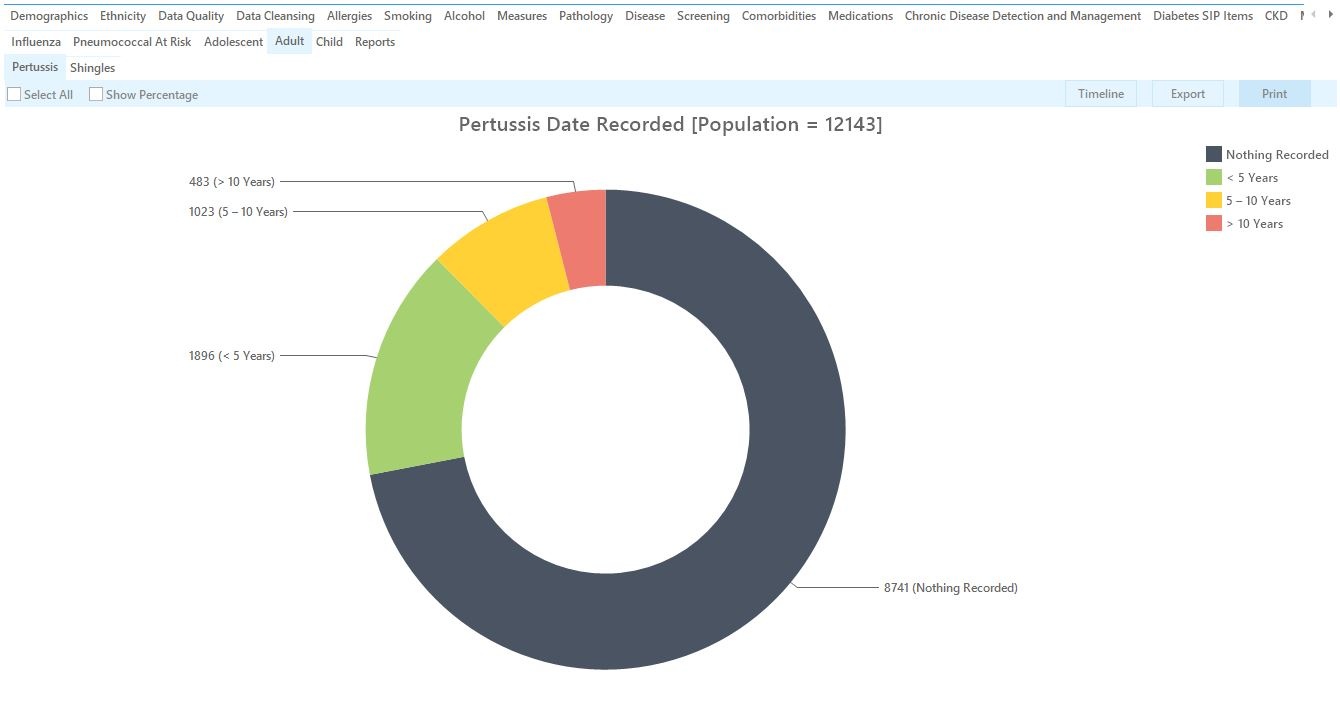
Pertussis graph
This graph needs to be filtered for the population of risk - please refer to the relevant immunisation guidelines to determine the filters to be used. By default all patients are shown in the report.
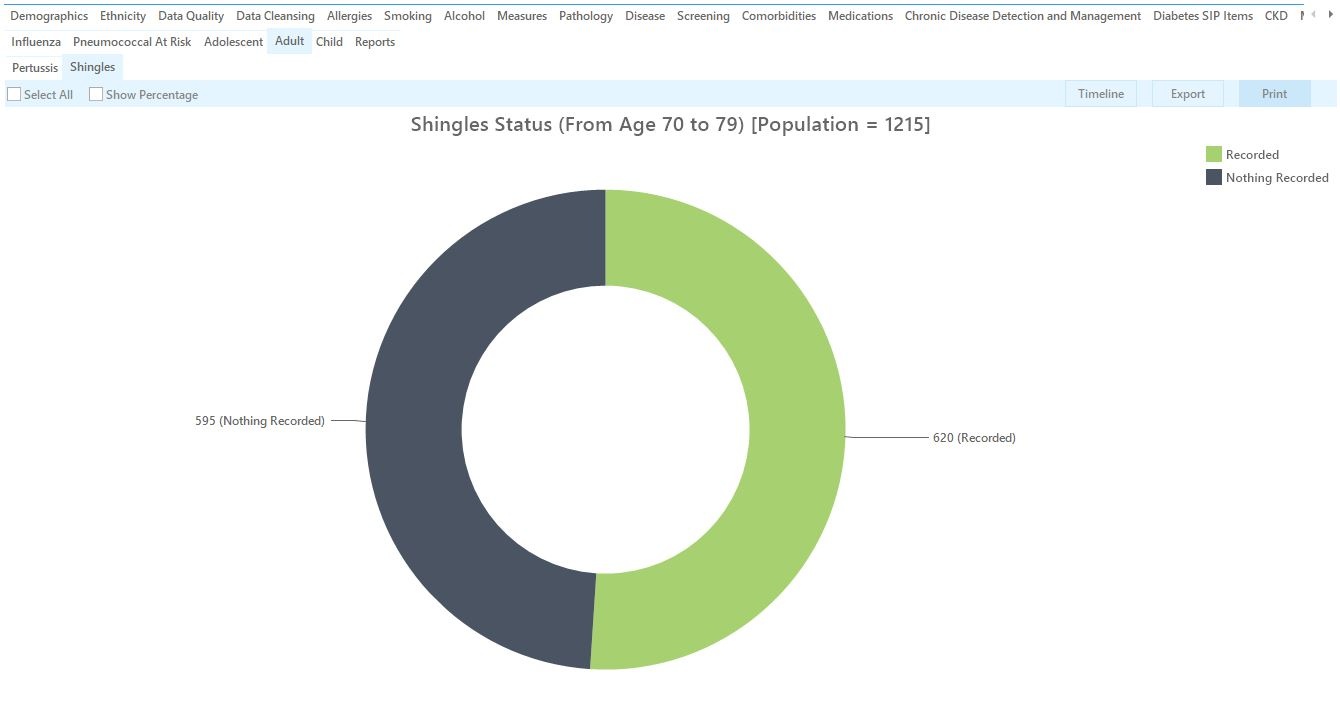
Graphs > Shingles
The Immunisations > Adult > Shingles graph provides a pie chart by immunisation status.
The population aged between 70 and 79 years will be displayed by default.
The categories provided are:
- Recorded
- Not Recorded