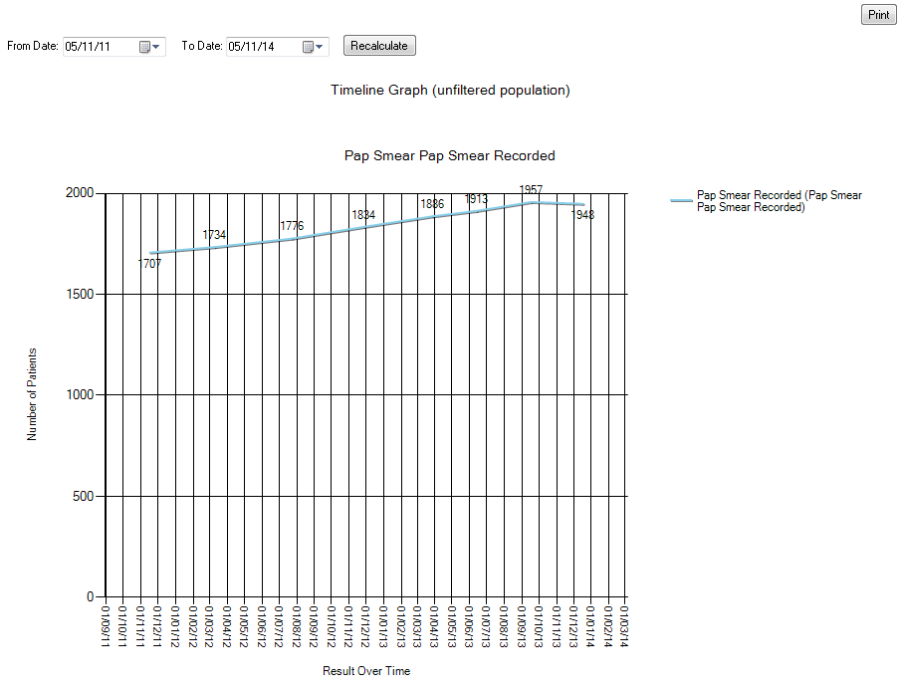
The Timeline functionality allows you to view changes in your data extracts over time. Most graphs have a 'Timeline' button at the top right near the 'Export' and 'Print' buttons.
Note that the timeline only shows data from the total patient population – it does not work with filters.
- Click segments from any graph(s) you like
- The 'Timeline' button of a graph becomes active when a segment is selected on that graph
- Click any active 'Timeline' button
- The Timeline graph is loaded into the 'new Timeline' tab at the far right of the tabs
Figure 72: Timeline
TIPS:
- If you add or remove graph segments you can return to the 'Timeline' tab and click the Timeline 'Recalculate' button to refresh the graph
- The 'From' and 'To' Dates default to cover a year before the extract date. Adjust these to include older extracts if you have them. If an extract does not appear you may simply need to reload it – this will create summary data for the timeline which may not have previously been created.
