Page History
Demographics displays your data set as a breakdown of males/females and age group. The data is displayed as a bar chart of the number of patients per age group. Age group defaults to years but can be changed to months by selecting 'Mths' in the Age filter.
Choosing to view demographics in months allows children to be targeted.
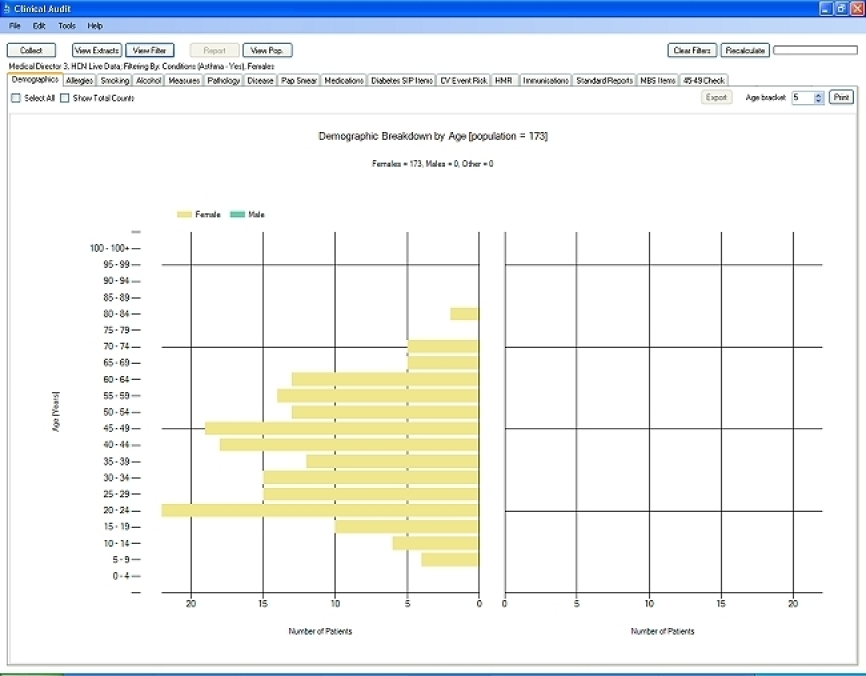
Figure 41: Demographics Report
The bar chart report provides the following features:
...
These are explained below.
Select All checkbox – click this checkbox to select all segments of the graph (legend is also selected)
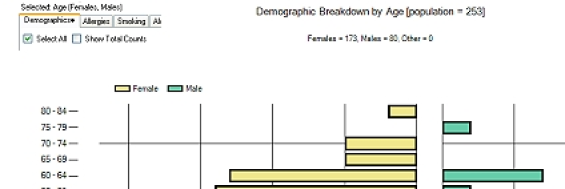
Figure 42: Select All
Show Total Counts checkbox – click this checkbox to display the count in each group.
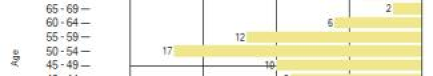
Figure 43: Show Total Counts
Age Bracket selection box – this allows you to select an age bracket value between 1 and 10 years. The default value is 5 which displays ages grouped from 0-4, 5-9 etc. Changing this value, for example to 10, would display as below. The change is effected immediately on the chart.
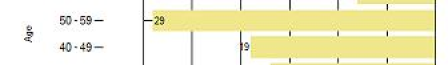
Figure 44: Age bracket selection
Print button – click the 'Print' button to print a copy of the graph.
Export button – this allows you to obtain a list of patients making up any segment of the bar chart. If you click on any segment of the bar chart it will become highlighted and the 'Export' button in the right hand corner of the results panel will become active. You can select more than one segment of the graph.
Once a segment of the chart is highlighted, the Export button becomes active

Figure 45: Export Button
Click the 'Export' button to get a list of the patients that make up this group. This works the same way as the 'View Population' button except that you not looking at the filtered population but are drilling down to a subset of only those patients selected on the graph.
The Patient Reidentification Report window will pop up with a list of patient details. The specific values related to the report you choose will be provided in the last column. In the example below the HbA1c report was chosen and you can see the result and date it was taken in the last columns. This will be the same for all reports and can be very useful for reports in the clinic or to create your own graphs in Excel.
Use the 'Export' menu option to export the data to Excel format for follow up, if required.
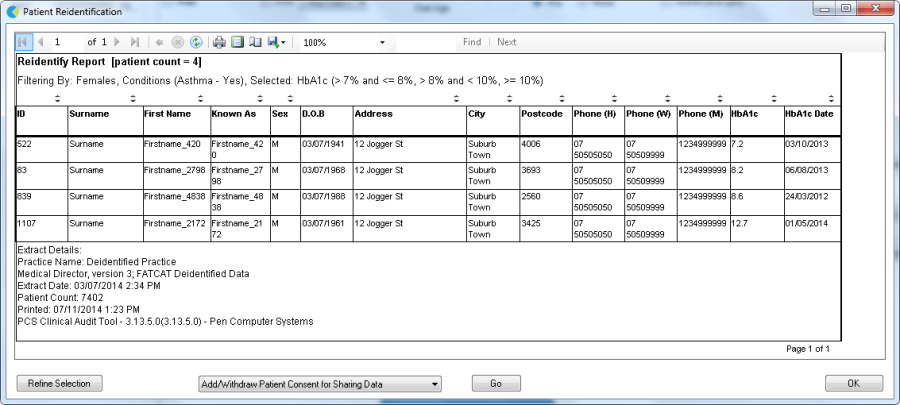
Figure 46: Patient Re-identify Report for selected report segments