Page History
...
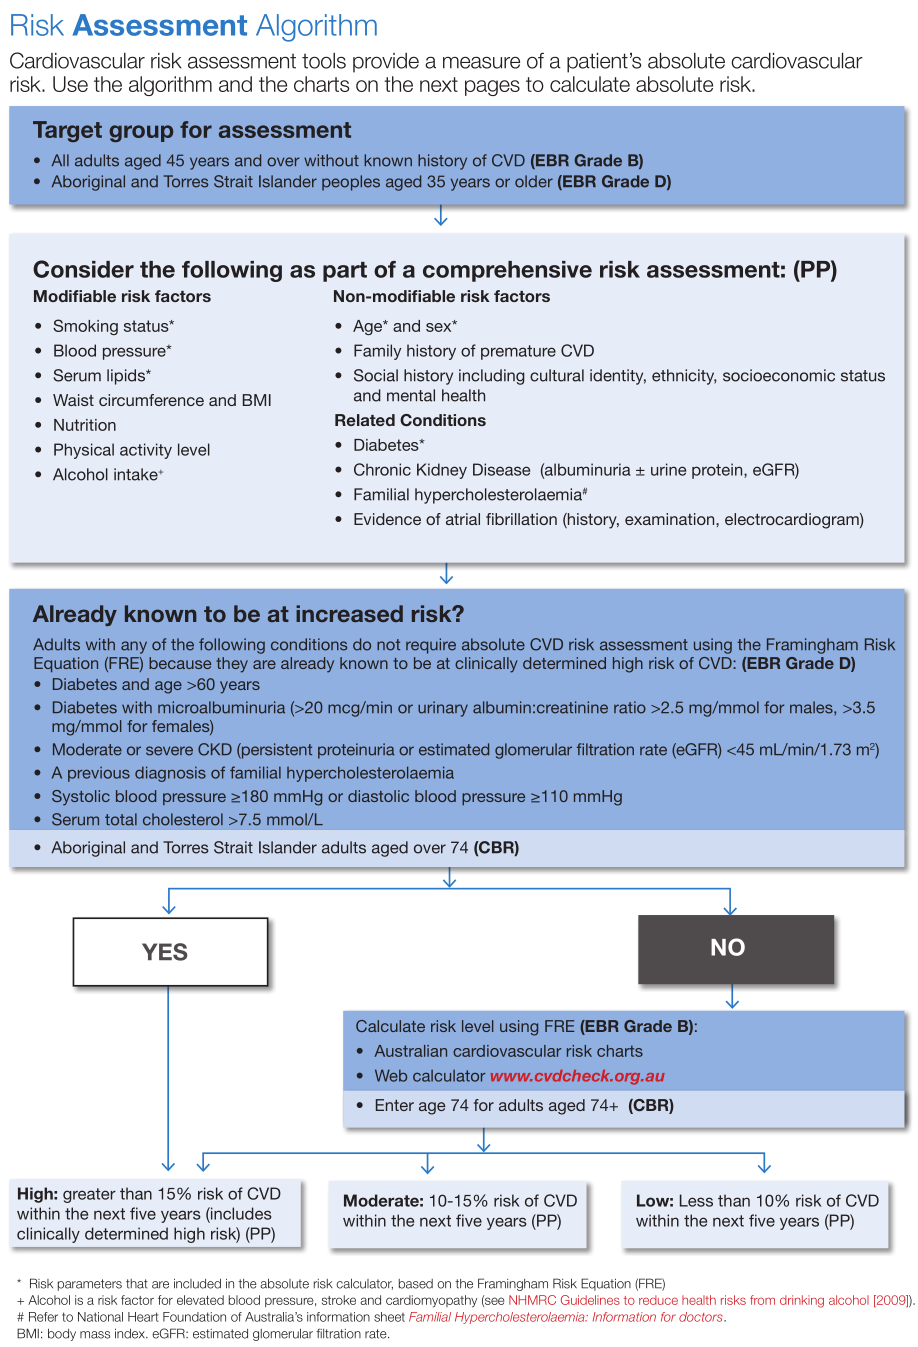
The algorithm used is shown in this flowchart:
Incomplete data
 More details are available on this page: https://www.cvdcheck.org.au/australian-absolute-cardiovascular-disease-risk-calculator
CV Event Risk displays your data as a breakdown of the % 5 Year Risk of a Cardiovascular Event: >=30%, 25-29%, 20-24%, 16-19%, 10-15%, 5-9% and <5%. The data is displayed as count per age range in a bar chart.
Chart functions available are as described for Demographics (Bar Chart).
The graph provides a total population number (the filtered population) and an eligible population number. The eligible population is the number of patients in your filtered dataset that can be assessed for risk i.e. patients that do not fall into one of the excluded groups.
The 'Count' on the Count graph will show you the total of the patients graphed – this is the total number of patients where CV Event Risk has been able to be calculated.
The eligible population – graph count = patients with incomplete data where no risk can be calculated. These patients are displayed on the second tab. In the example below there are 2802 patients eligible with 1300 displayed out of a total of 7402.
By selecting the high risk sections of the bar chart and clicking the 'Export' button a list of the patients that make up this group can be obtained. This provides valuable information for practice staff working to improve chronic disease management and prevention. The information can also, for example, be used to substantiate the 45-49 year old health check.
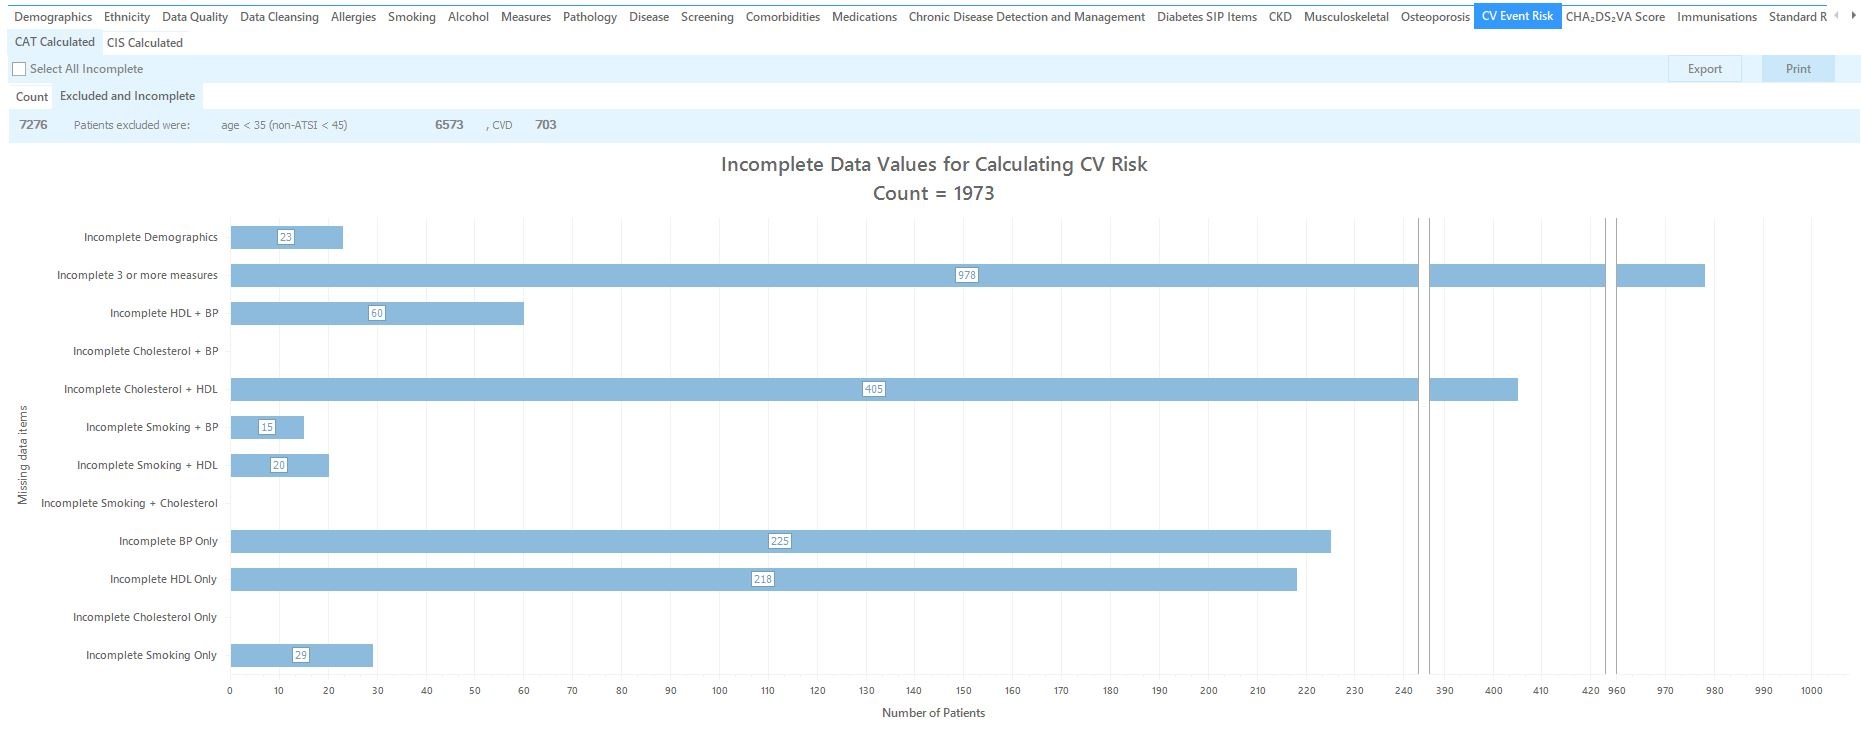
Within the eligible population a patient may have incomplete results for the data items used in the calculation. The % risk therefore cannot be calculated for these patients.
This data is displayed under the tab. 4600 patients were excluded, out of those 219 because they already were diagnosed with a CVD.
1502 patients had incomplete date for the risk calculation – which together with the 1300 displayed on the previous graph adds up to the total of 2802 eligible patients.
Incomplete data
This horizontal bar chart helps practice staff improve their data quality by identifying patients with missing data. The Export button can be used for this purpose as described above.
...