Page History
The Demographics tab displays your data set as a breakdown of males/females and age group on the Population Pyramid tab and as a bar chart on the Age Profile (RACGP) tab .
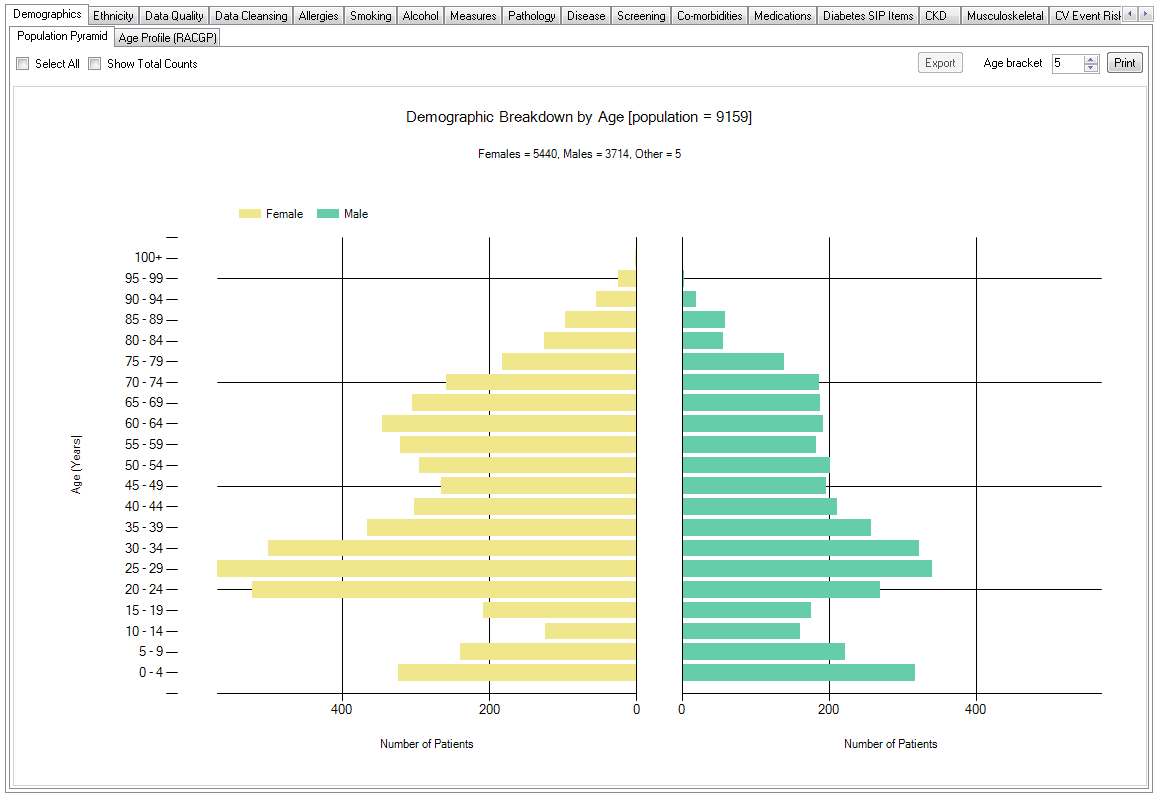
Population Pyramid
The data is displayed as a bar chart of the number of patients per age group. Age group defaults to years but can be changed to months by selecting 'Mths' in the Age filter.
Choosing to view demographics in months allows children to be targeted.
| Excerpt |
|---|
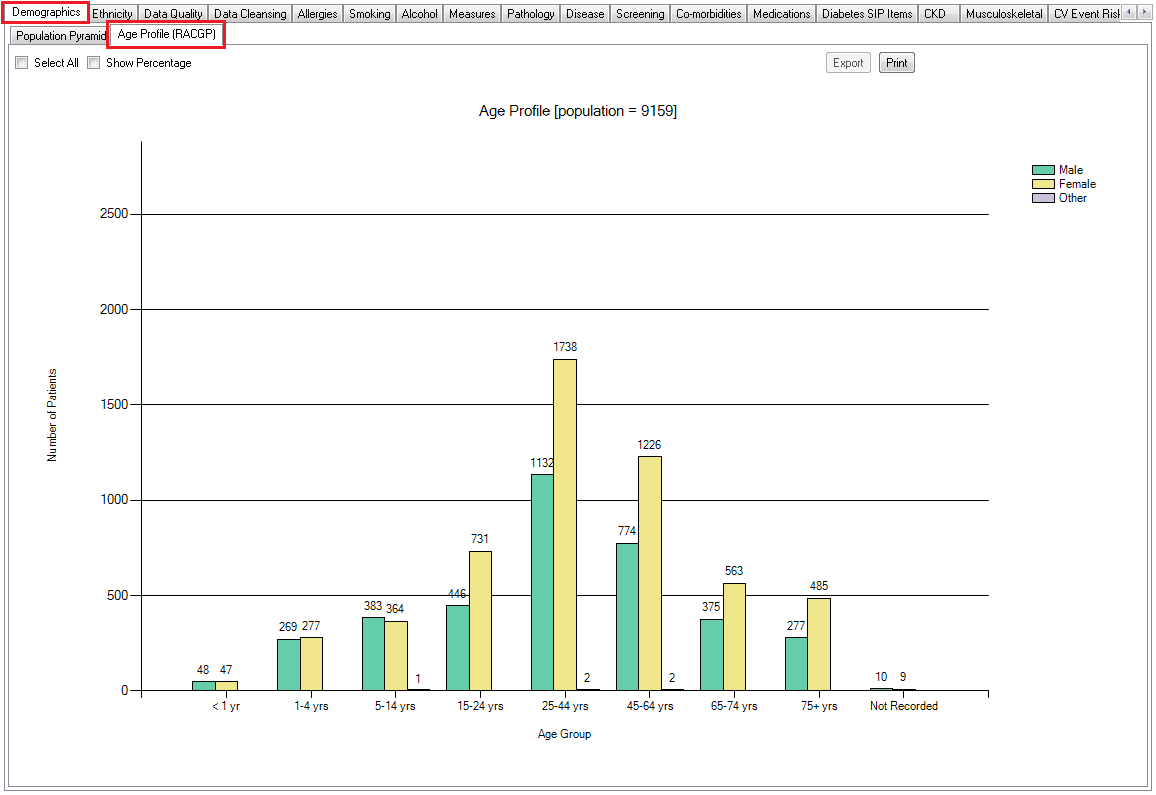
Age Profile (RACGP) This tab shows a bar chart of patients by age and gender grouped in age groups tailored to the RACGP Quality Improvement & Continuing Professional Development plan. This report will enable participants to answer the questions about the age of the patients attending the practice or seen by a particular provider. Filters can be used to show only a particular group of patients such as those assigned to one provider or those visited in a particular time period only.
|
All 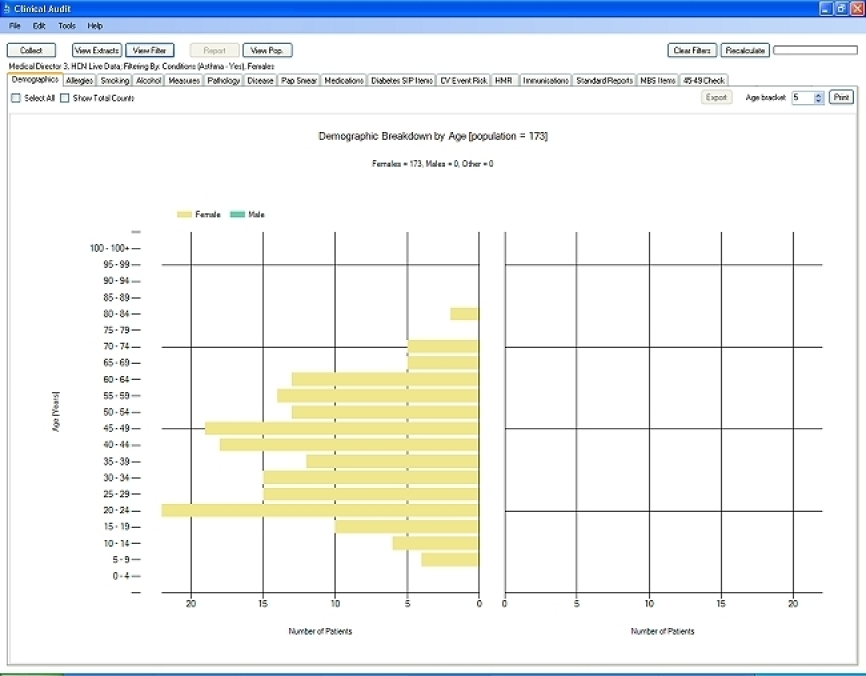
The bar chart report provides the following features:
...