Page History
...
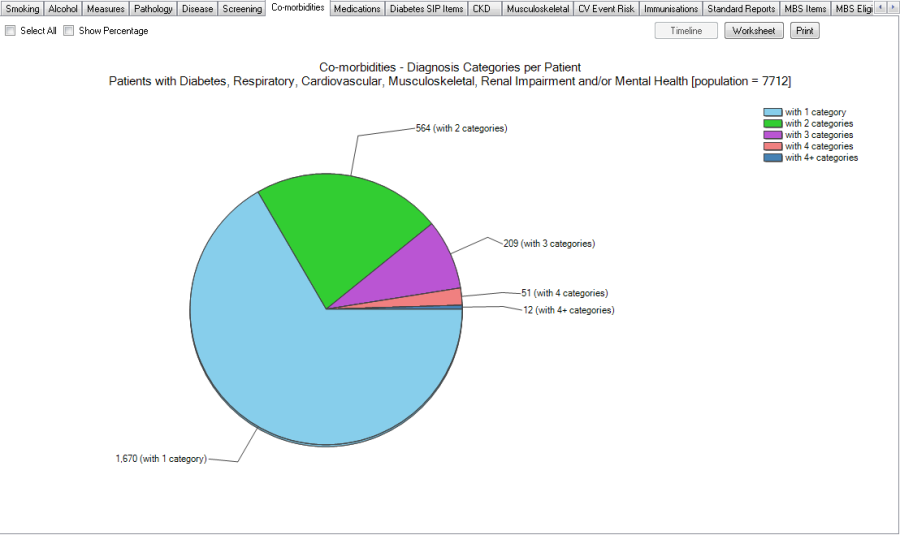
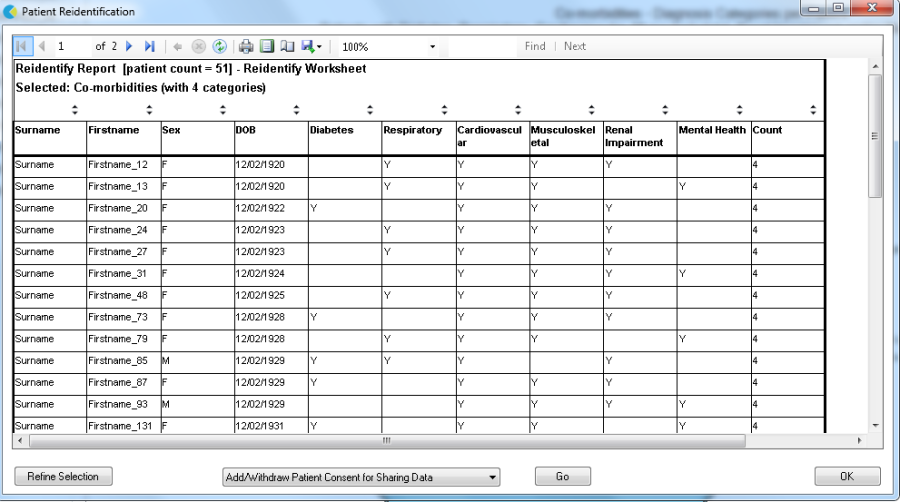
The data is displayed in a pie chart and lists patients with 1, 2, 3, 4 and more than 4 conditions. When part of the graph is selected, the 'Worksheet' button in the top right corner provides patient details and which conditions they have been diagnosed with. Please note that Mental Health is included in this report and patients with a mental health diagnosis and no other chronic condition will be counted in the report.
This report uses the same rules for disease mapping as the 'Disease' report.