Page History
...
The National Vascular Disease Prevention Alliance (NVDPA) The National Vascular Disease Prevention Alliance (NVDPA) includes the Heart Foundation, National Stroke Foundation, Kidney Health Australia and Diabetes Australia. Guidelines for the management of absolute cardiovascular disease risk has been developed through an evidence and consensus-based approach, and has received endorsement from the National Health and Medical Research Council.
The National Health and Medical Research Council–approved guidelines build on the cardiovascular disease (CVD) risk assessment guidelines, which introduced a new way of calculating CVD risk for people in Australia, released in 2009.
"Absolute cardiovascular risk assessment, using the Framingham Risk Equation to predict risk of a cardiovascular event over the next 5 years, should be performed for all adults aged over 45years without existing CVD or not already known to be at increased risk of CVD. Commence assessment in Aboriginal and Torres Strait Islander adults at 35 years."
In the guidelines, absolute risk is defined as the numerical probability of a cardiovascular event occurring within a 5-year period. This is a more accurate prediction of a person's 'individualised' risk of CVD, compared with traditional methods based on single risk factor assessments (e.g. high cholesterol, high blood pressure etc).
This release represents an important step towards improving health outcomes by establishing a more integrated approach to cardiovascular disease prevention and management in Australia. clinical decisions based on absolute CVD risk will help direct lifestyle advice and medicines to those who have the most to benefit.
| Excerpt | |||||
|---|---|---|---|---|---|
|
Health professionals can access a range of related resources at http://www.cvdcheck.org.au : including the CVD online risk calculator.
The Framingham Risk Equation (FRE)
...
- Age
- Gender
- Systolic BP (mm Hg)
- Total Cholesterol (Mg/dL)
- HDL (Mg/dL)
- Smoking Status (Smoker/Non-smoker)
- Diabetes
- ECG-LVH (always set to 0) ECG-LVH: ECG (EchocardiogramElectrocardiogram) is a test and LVH (Left Ventricular Hypertrophy) is a condition that is detected by this test. If LVH is detected as definite this value in the FRE is set to 1, otherwise it is set to 0. Currently the outcome of this test is not recorded as a coded value in the clinical software packages and therefore cannot be extracted. Hence, this value is always set to 0.
The algorithm used is shown in this flowchart:
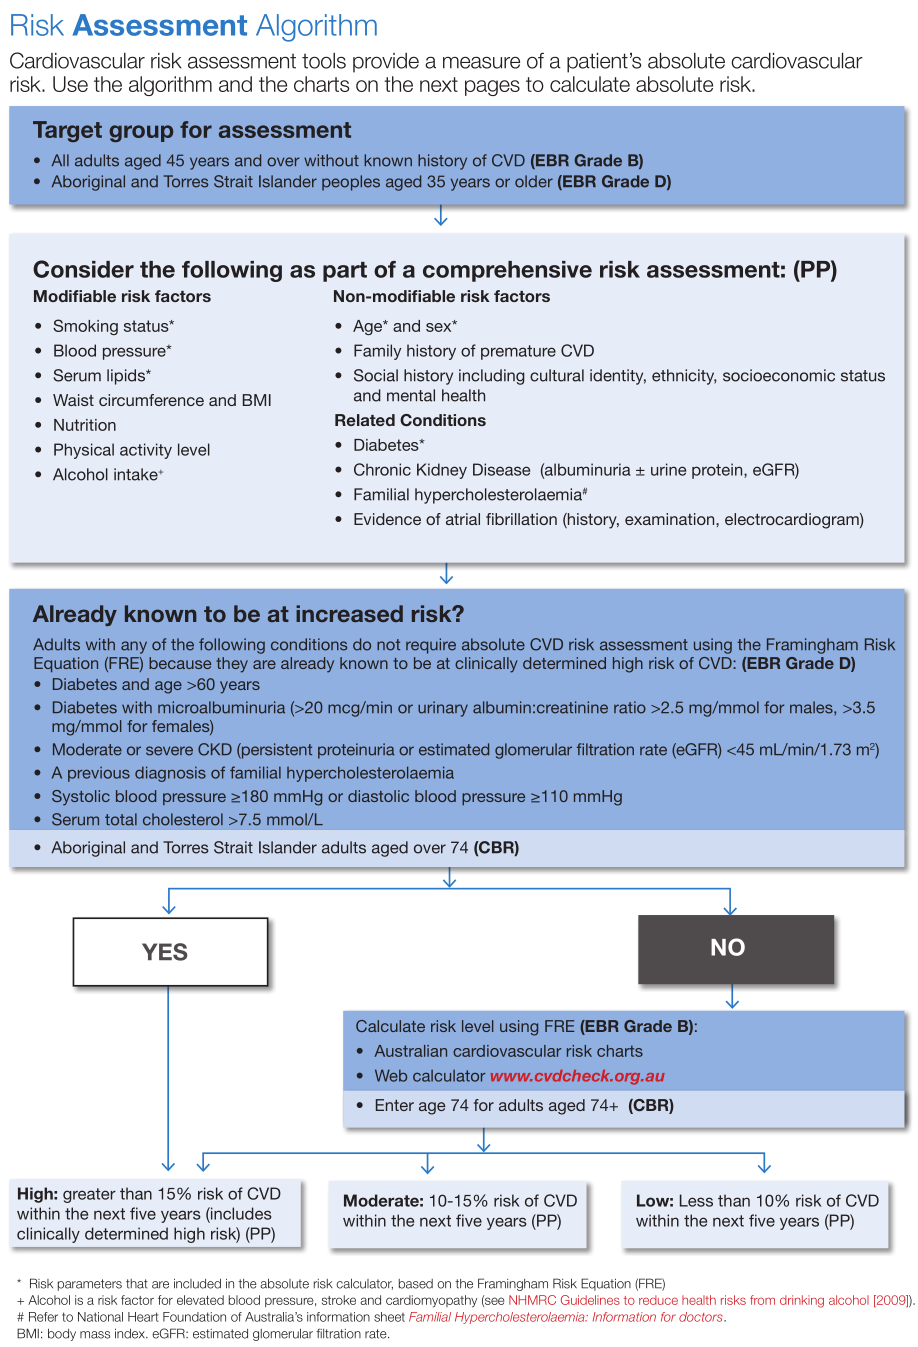
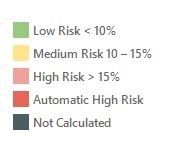
The report shows the patients who had their risk score calculated based on the Framingham equation as detailed above as well as those who had their risk automatically calculated following the flow chart shown above. Patients without a score due to incomplete data are shown as 'Not calculated', for the others the risk is displayed from low risk to high risk :
Note:
Total Population = Total population.
Eligible Population = Population who are at risk of a cardiovascular event.
Count = Population with complete data, where a risk score could be calculated.
Percentage = Count / Eligible Population.
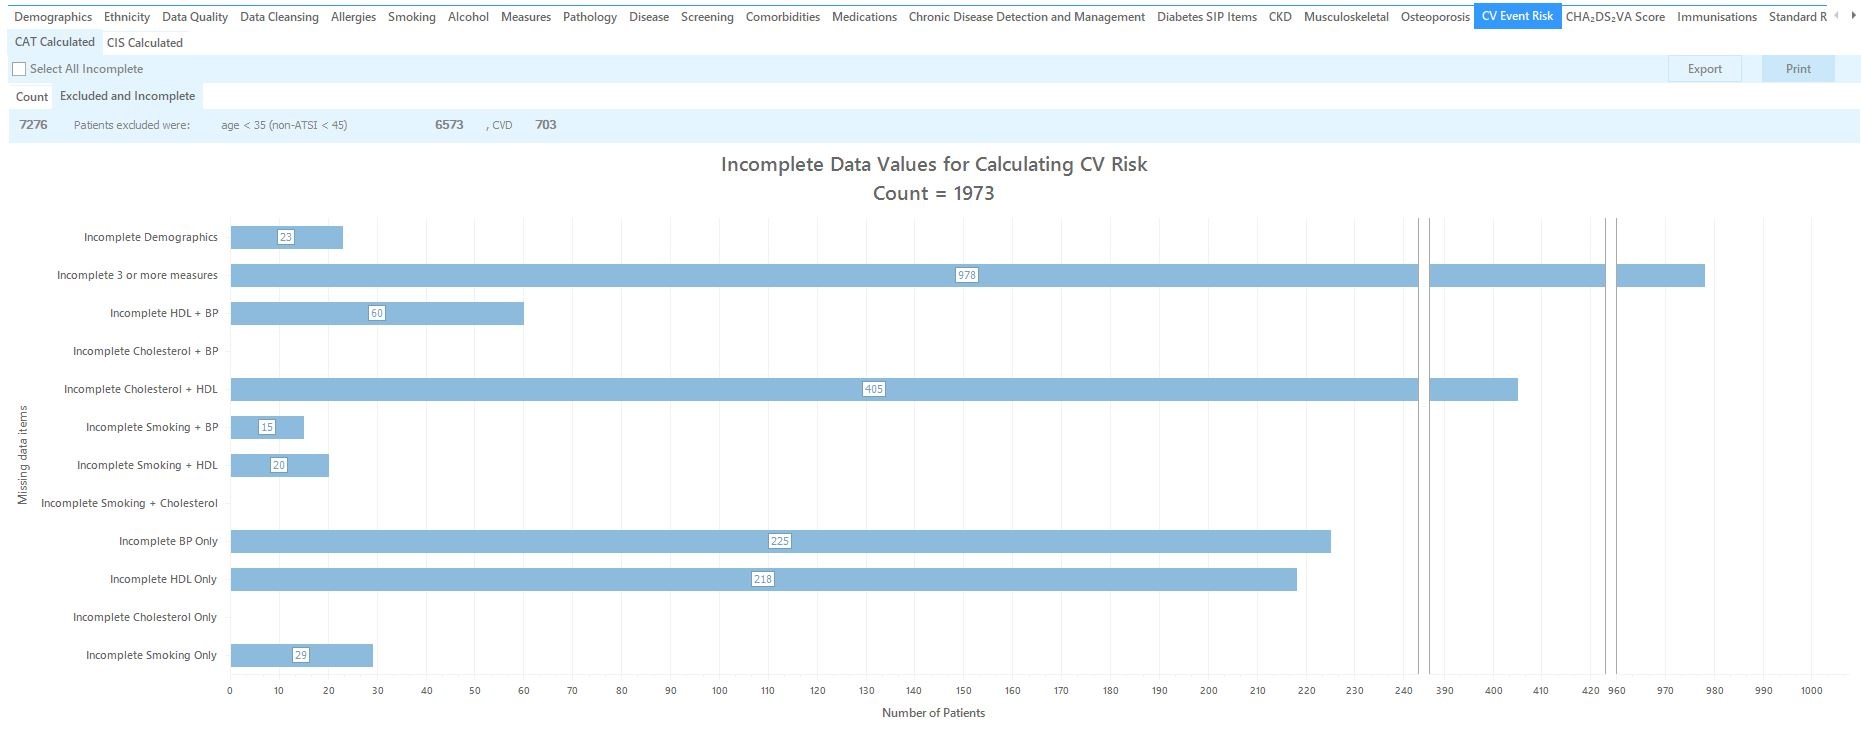
Incomplete data
 More details are available on this page: https://www.cvdcheck.org.au/australian-absolute-cardiovascular-disease-risk-calculator
CV Event Risk displays your data as a breakdown of the % 5 Year Risk of a Cardiovascular Event: >=30%, 25-29%, 20-24%, 16-19%, 10-15%, 5-9% and <5%. The data is displayed as count per age range in a bar chart.
Chart functions available are as described for Demographics (Bar Chart).
The graph provides a total population number (the filtered population) and an eligible population number. The eligible population is the number of patients in your filtered dataset that can be assessed for risk i.e. patients that do not fall into one of the excluded groups.
The 'Count' on the Count graph will show you the total of the patients graphed – this is the total number of patients where CV Event Risk has been able to be calculated.
The eligible population – graph count = patients with incomplete data where no risk can be calculated. These patients are displayed on the second tab. In the example below there are 2802 patients eligible with 1300 displayed out of a total of 7402.
By selecting the high risk sections of the bar chart and clicking the 'Export' button a list of the patients that make up this group can be obtained. This provides valuable information for practice staff working to improve chronic disease management and prevention. The information can also, for example, be used to substantiate the 45-49 year old health check.
Within the eligible population a patient may have incomplete results for the data items used in the calculation. The % risk therefore cannot be calculated for these patients.
This data is displayed under the tab. 4600 patients were excluded, out of those 219 because they already were diagnosed with a CVD.
1502 patients had incomplete date for the risk calculation – which together with the 1300 displayed on the previous graph adds up to the total of 2802 eligible patients.
Incomplete data
This horizontal bar chart helps practice staff improve their data quality by identifying patients with missing data. The Export button can be used for this purpose as described above.
Excluded data
The number of patients that have been excluded is provided in order of exclusion category: <35 (<45 non ATSI), CVD. Once a patient is excluded for meeting an exclusion category they are not counted in subsequent categories.
The content from the publication "National Vascular Disease Prevention Alliance. Guidelines for the assessment of absolute cardiovascular disease risk. 2009" was used with permission from the Heart Foundation (copyright material). Updates to these guidelines can be found at http://www.cvdcheck.org.au.
...