Page History
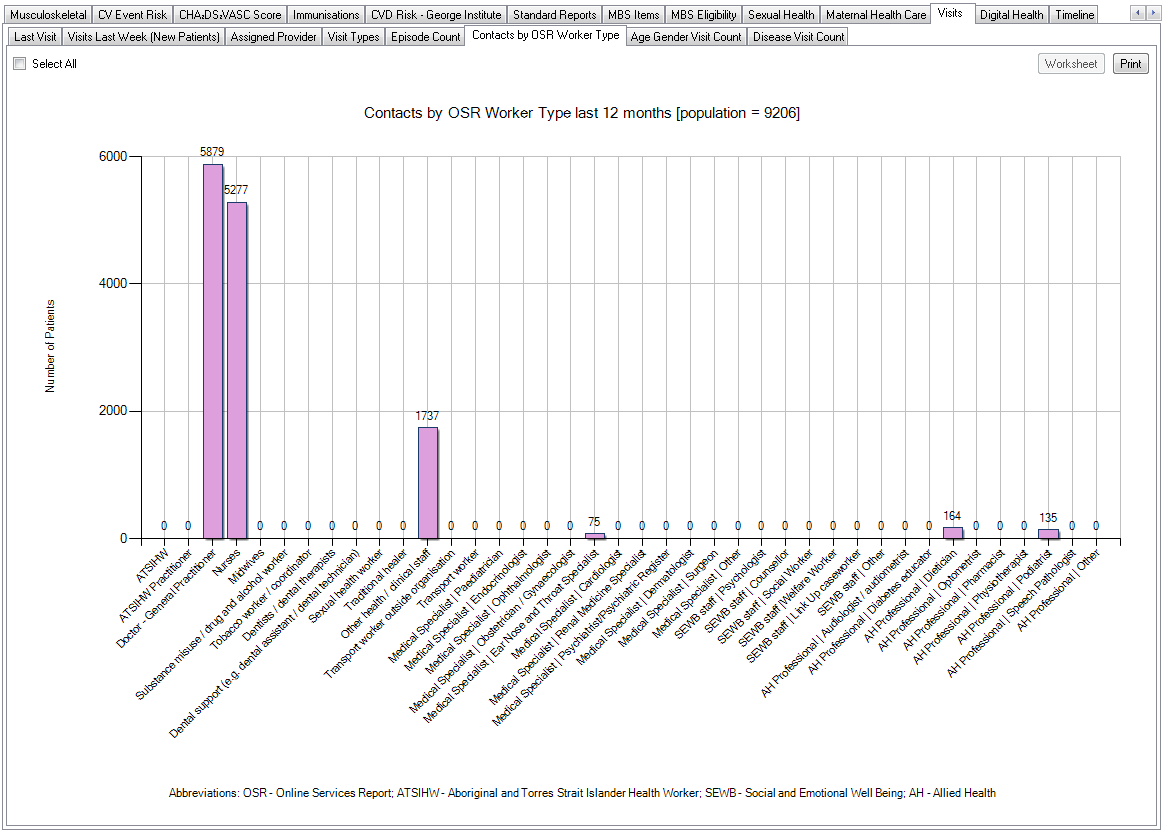
This report shows a bar chart for the number of contacts provided to clients in the last 12 months for each worker type Worker type mappings for Medical Director (MD), Best Practice (BP) and Communicare are provided in the Appendix at the end of the OSR Quick Reference Guide available at help.pencs.com.au/cat.htm CAT OSR Reporting Indicators
.
This graph supports the OSR Report Indicator CS-2.
- Graphs for Other OSR Visit Types (SEWB, Linkup and Substance Use) are provided for Communicare users.
- After Hours Reporting – this tab has moved under Views > After Hours Reporting
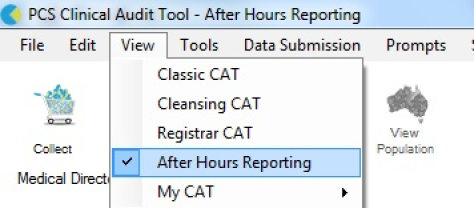
Figure 63: After Hours Reporting
These graphs can be used in conjunction with other CAT4 graphs to help target patients. Select segments and use the 'Report' button (under the top menu) to create a cross tabulation report of clinical data, provider and last visit.