Page History
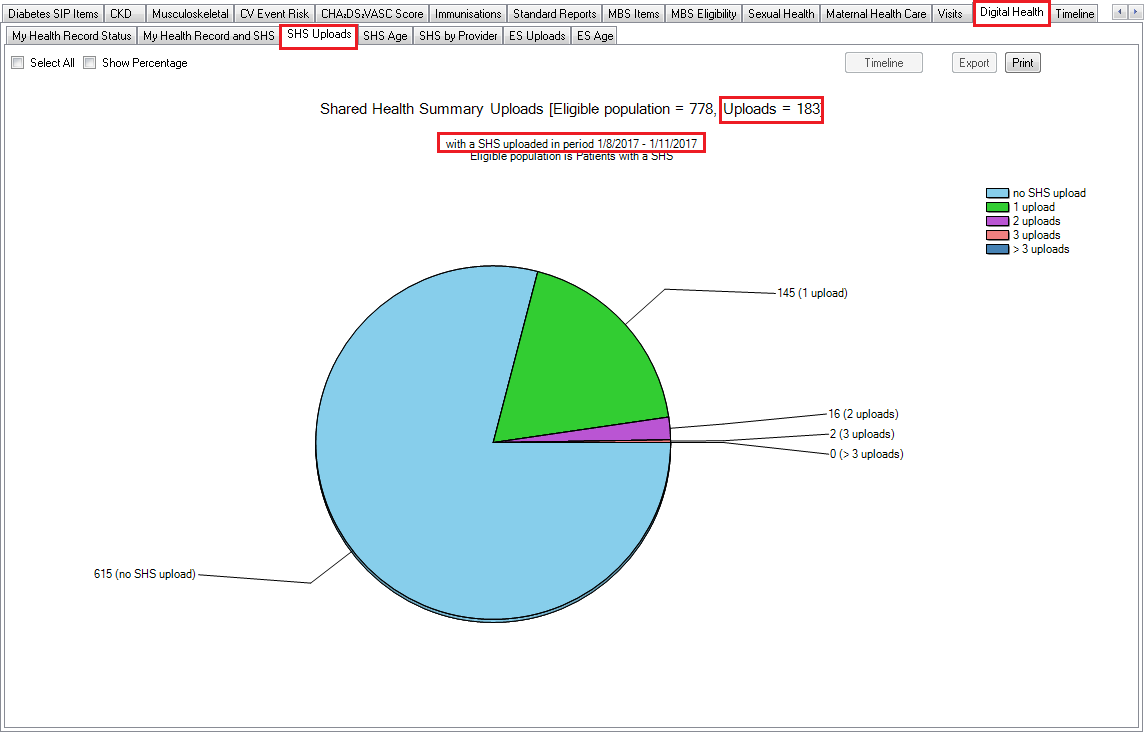
This graph will show patients that have a SHS (the number will match that on the My Health Record and SHS graph) and, of that group, the number of times the SHS has been uploaded.
In most cases the Date Range (Results) filter should be used to find SHS's that have been last uploaded in a timeframe and will display the number of times in that timeframe.
Patients will only appear in the 'no SHS upload' category if their last upload date is outside the date range selected. If there is no date range filter applied this category will be empty. The title of the graph includes the eligible population (anyone with a SHS and the total number of uploads in the selected time period.
| Warning |
|---|
If you are comparing CAT4 SHS reports with other data you need to make sure the date ranges are matching. Government reports using weekly reports need to be carefully matched using the 'Date Range Result' filter to ensure CAT4 is reporting on the same period and/or patients! We have found that the MyHealth Record servers seem to work on UTC time, which means that any records uploaded before 10 AM will be counted for the previous day. This may vary depending on your location (times zones and daylight saving will change the time difference to UTC) but there could be a discrepancy between the reported uploads caused by this time issue. |