Page History
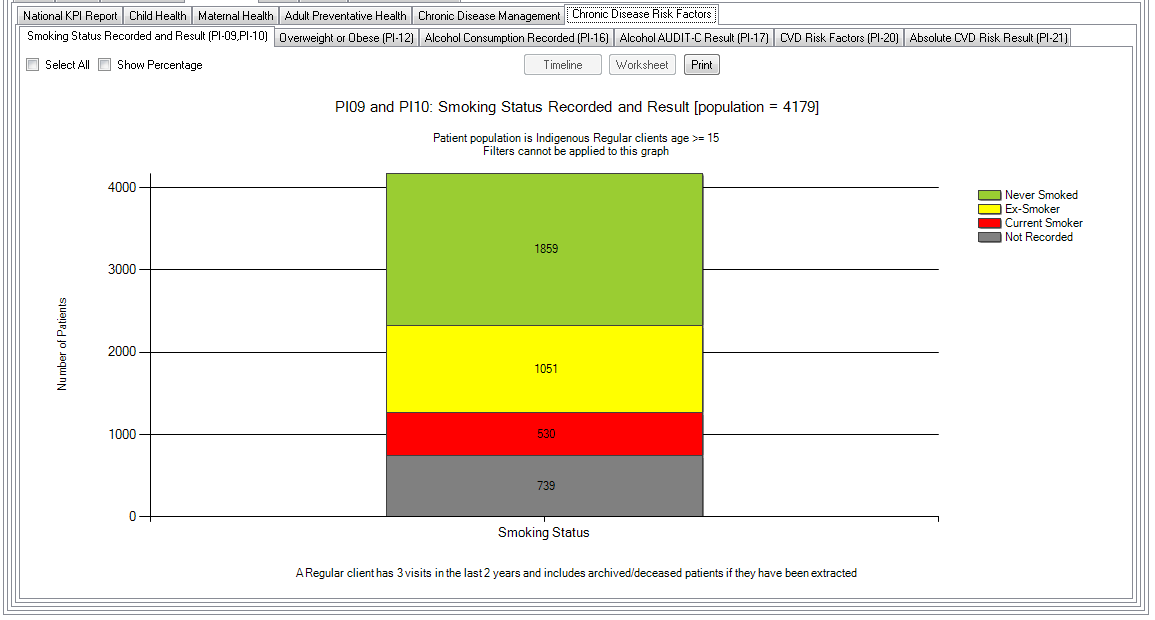
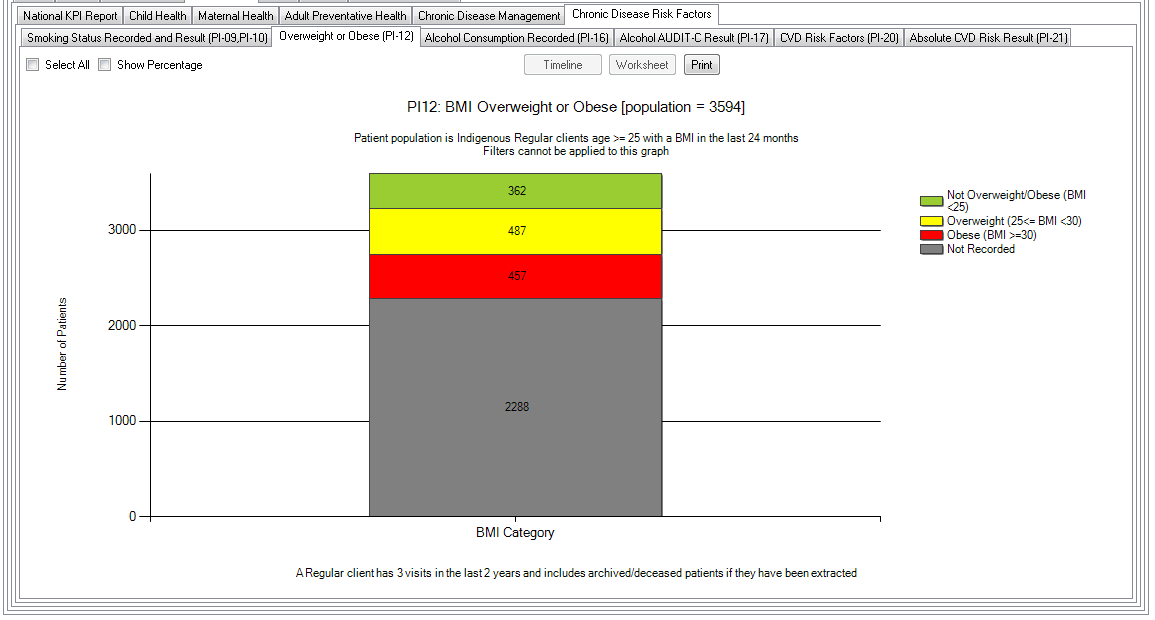
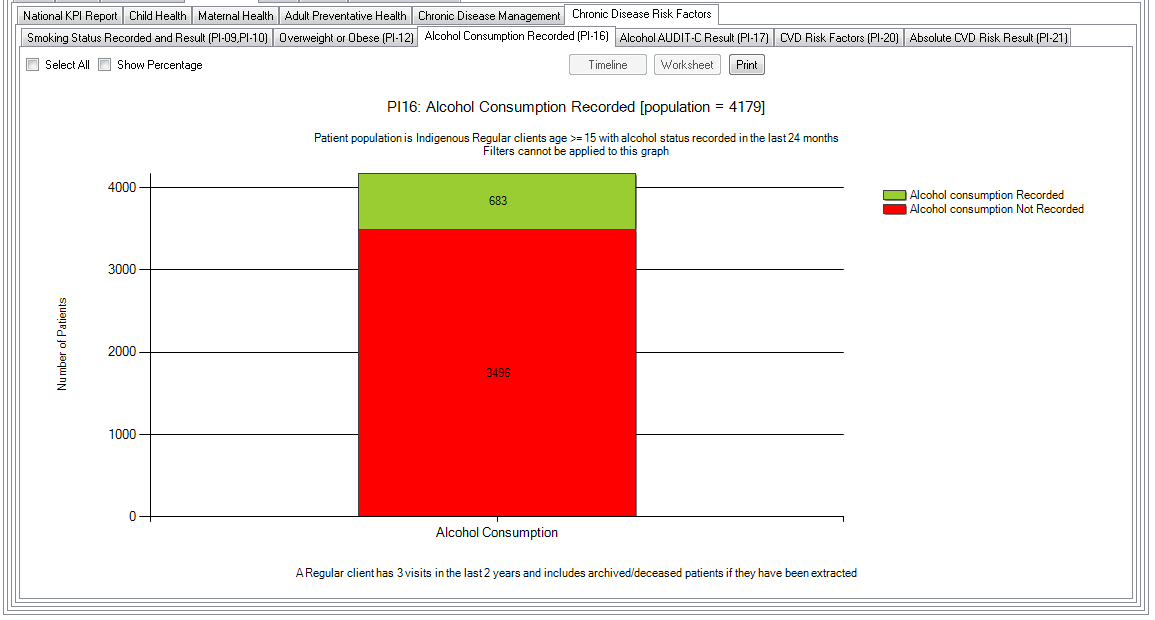
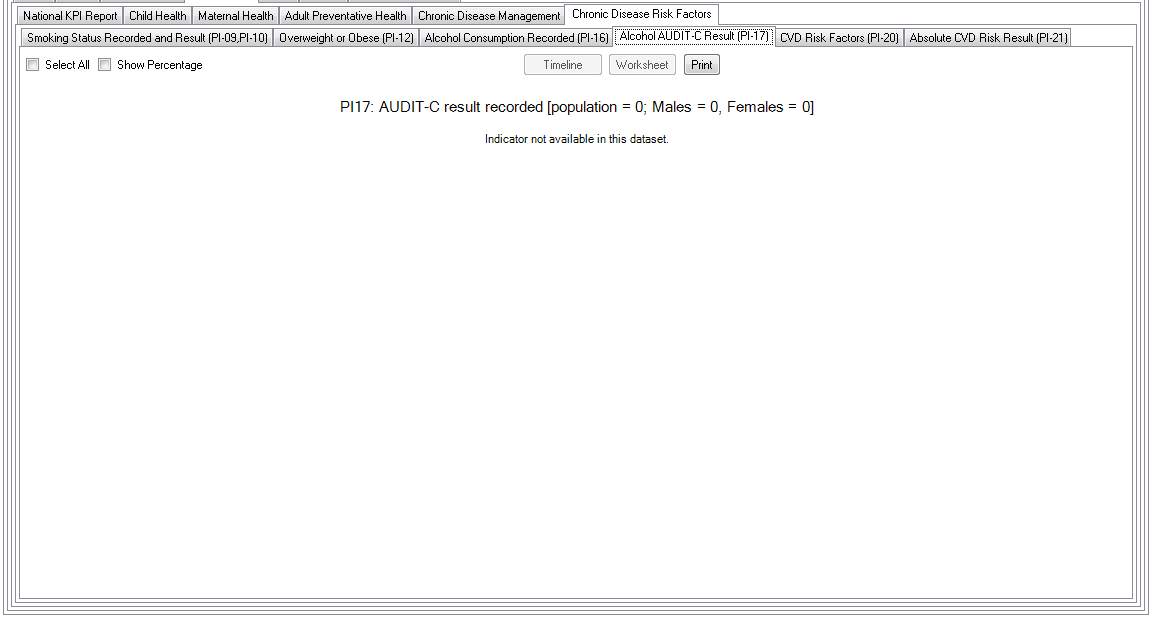
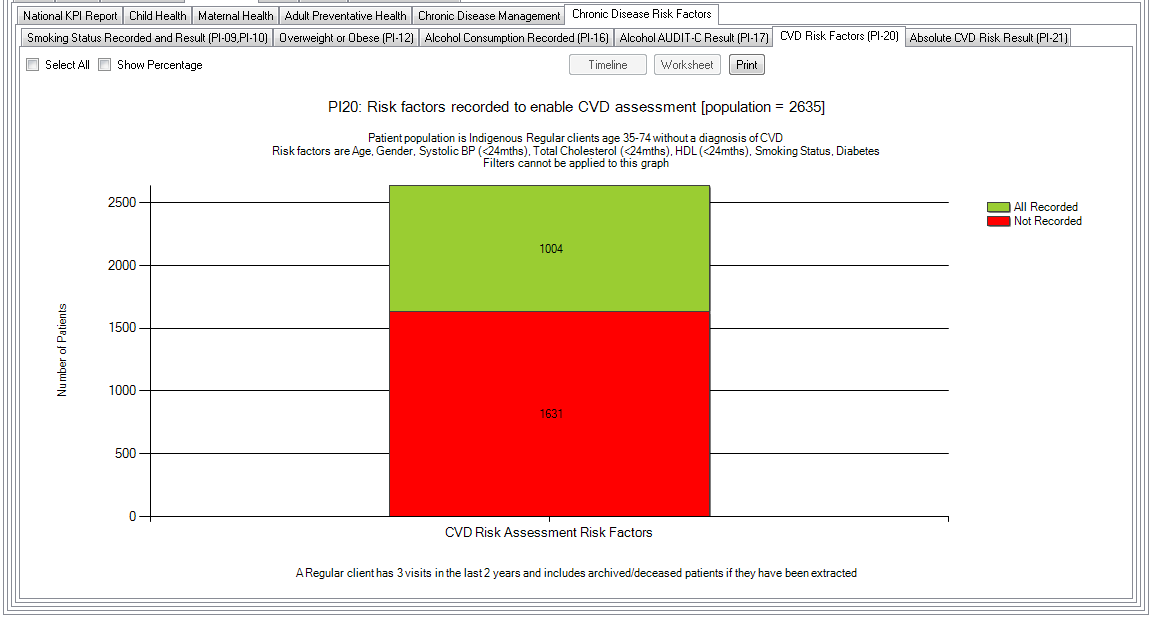
The graphs on this tab show multiple risk factors for the pre-filtered population. All graphs display the details of filters used and which indicator of the NKPI report the refer to. Please note the PI17 (alcohol audit-c results) and PI21 (absolute CVD risk assessment) are not available from all clinical systems. The graphs will be empty if your clinical system doesn't provide the information required for these indicators.