• Skip to main content
  • assistive.skiplink.to.breadcrumbs
  • assistive.skiplink.to.header.menu
  • assistive.skiplink.to.action.menu
  • assistive.skiplink.to.quick.search
  • Log in
  • Help / Tips Help
    • Online Help
    • Keyboard Shortcuts
    • Feed Builder
    • What’s new
    • Available Gadgets
    • About Confluence
  • Search
PenCS Help
  • Home
Hit enter to search
CAT GUIDES

    Content

  • Pages
  • Blog

    Space Tools

  • Settings
  • Content Tools
1476585
CG
3
    • Attachments (1)
    • Page History
    • Page Information
    • Resolved comments
    • View in Hierarchy
    • View Source
    • Export to PDF
    • Export to Word
  1. Pages
  2. CAT4 User Guide
  3. ANALYSING A DATA SET
  4. Reports and Graphs
Skip to end of banner
  • Jira links
Go to start of banner

STANDARD REPORTS

  • Created by user-529d4, last modified on 25 Sep, 2016

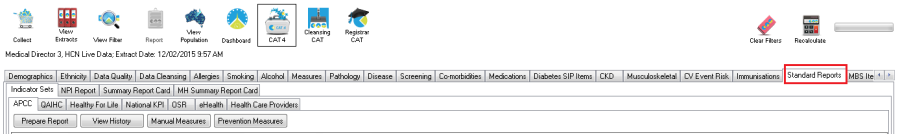
A number of reports are available under the 'Standard Reports' tab.


These are:
 

  • Indicator Sets
    • APCC (Australia Primary Care Collaboratives) Report
    • QAIHC Indicators Report
    • Healthy For Life Report
    • National KPI Report
      • NKPI Report Graphs
        • Child Health Graph
        • Maternal Health
        • Adult Preventative Health
        • Chronic Disease Management
          • Type II Diabetes Graphs
          • COPD
          • CVD Graphs
        • Chronic Disease Risk Factors
      • Collecting Additional Patients in CAT4 for Reporting
    • OSR Online Services Report
      • OSR Quick Reference Guide
    • eHealth Report
    • Health Care Providers Report
  • NPI (National Performance Indicators) Report
  • Summary Report Card
  • Mental Health (MH) Summary Report Card

Copyright Pen CS 2017. All Rights Reserved.

null