This guide contains all steps for a practice to login to CAT4, collect data, load the extract, export a JSON file and finally upload that JSON file to your PHN.
After CAT4 has been installed and configured (please contact your PHN and/or Pen CS support for assistance) you can log in using the user name and password provided by your PHN.
Click the Desktop Shortcut to start the program.
OR
- Click Start > All Programs > Pen Computer Systems > Pen CS clinical Audit Tool 4
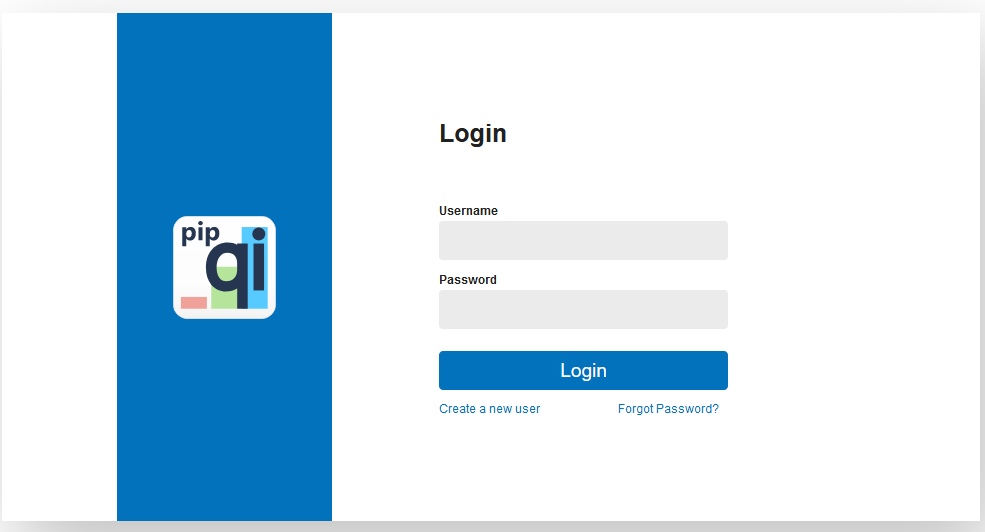
- This will load the login screen
- Enter your Username and Password and click 'Login'
- This will load the dashboard, allowing you to choose different views and other functionality. Please refer to the quick reference guide CAT4 Dashboard for full details
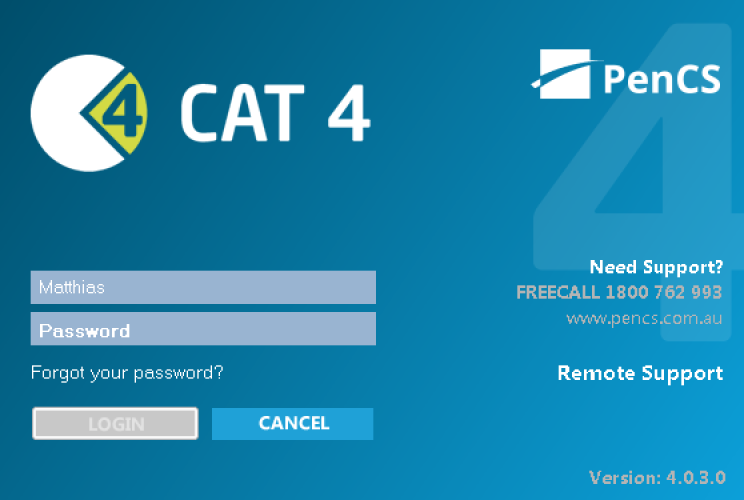
Figure2: CAT4 Logon Screen
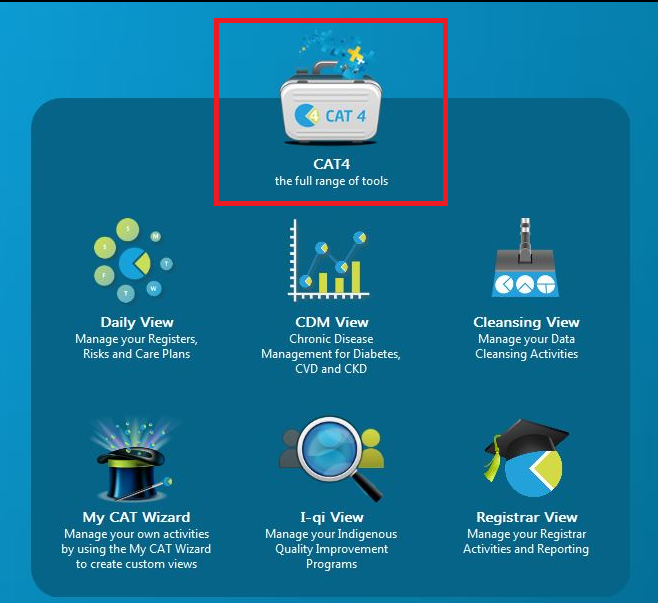
Once you have logged in, you will see the CAT4 dashboard. Click on the CAT4 view on the dashboard as shown below.
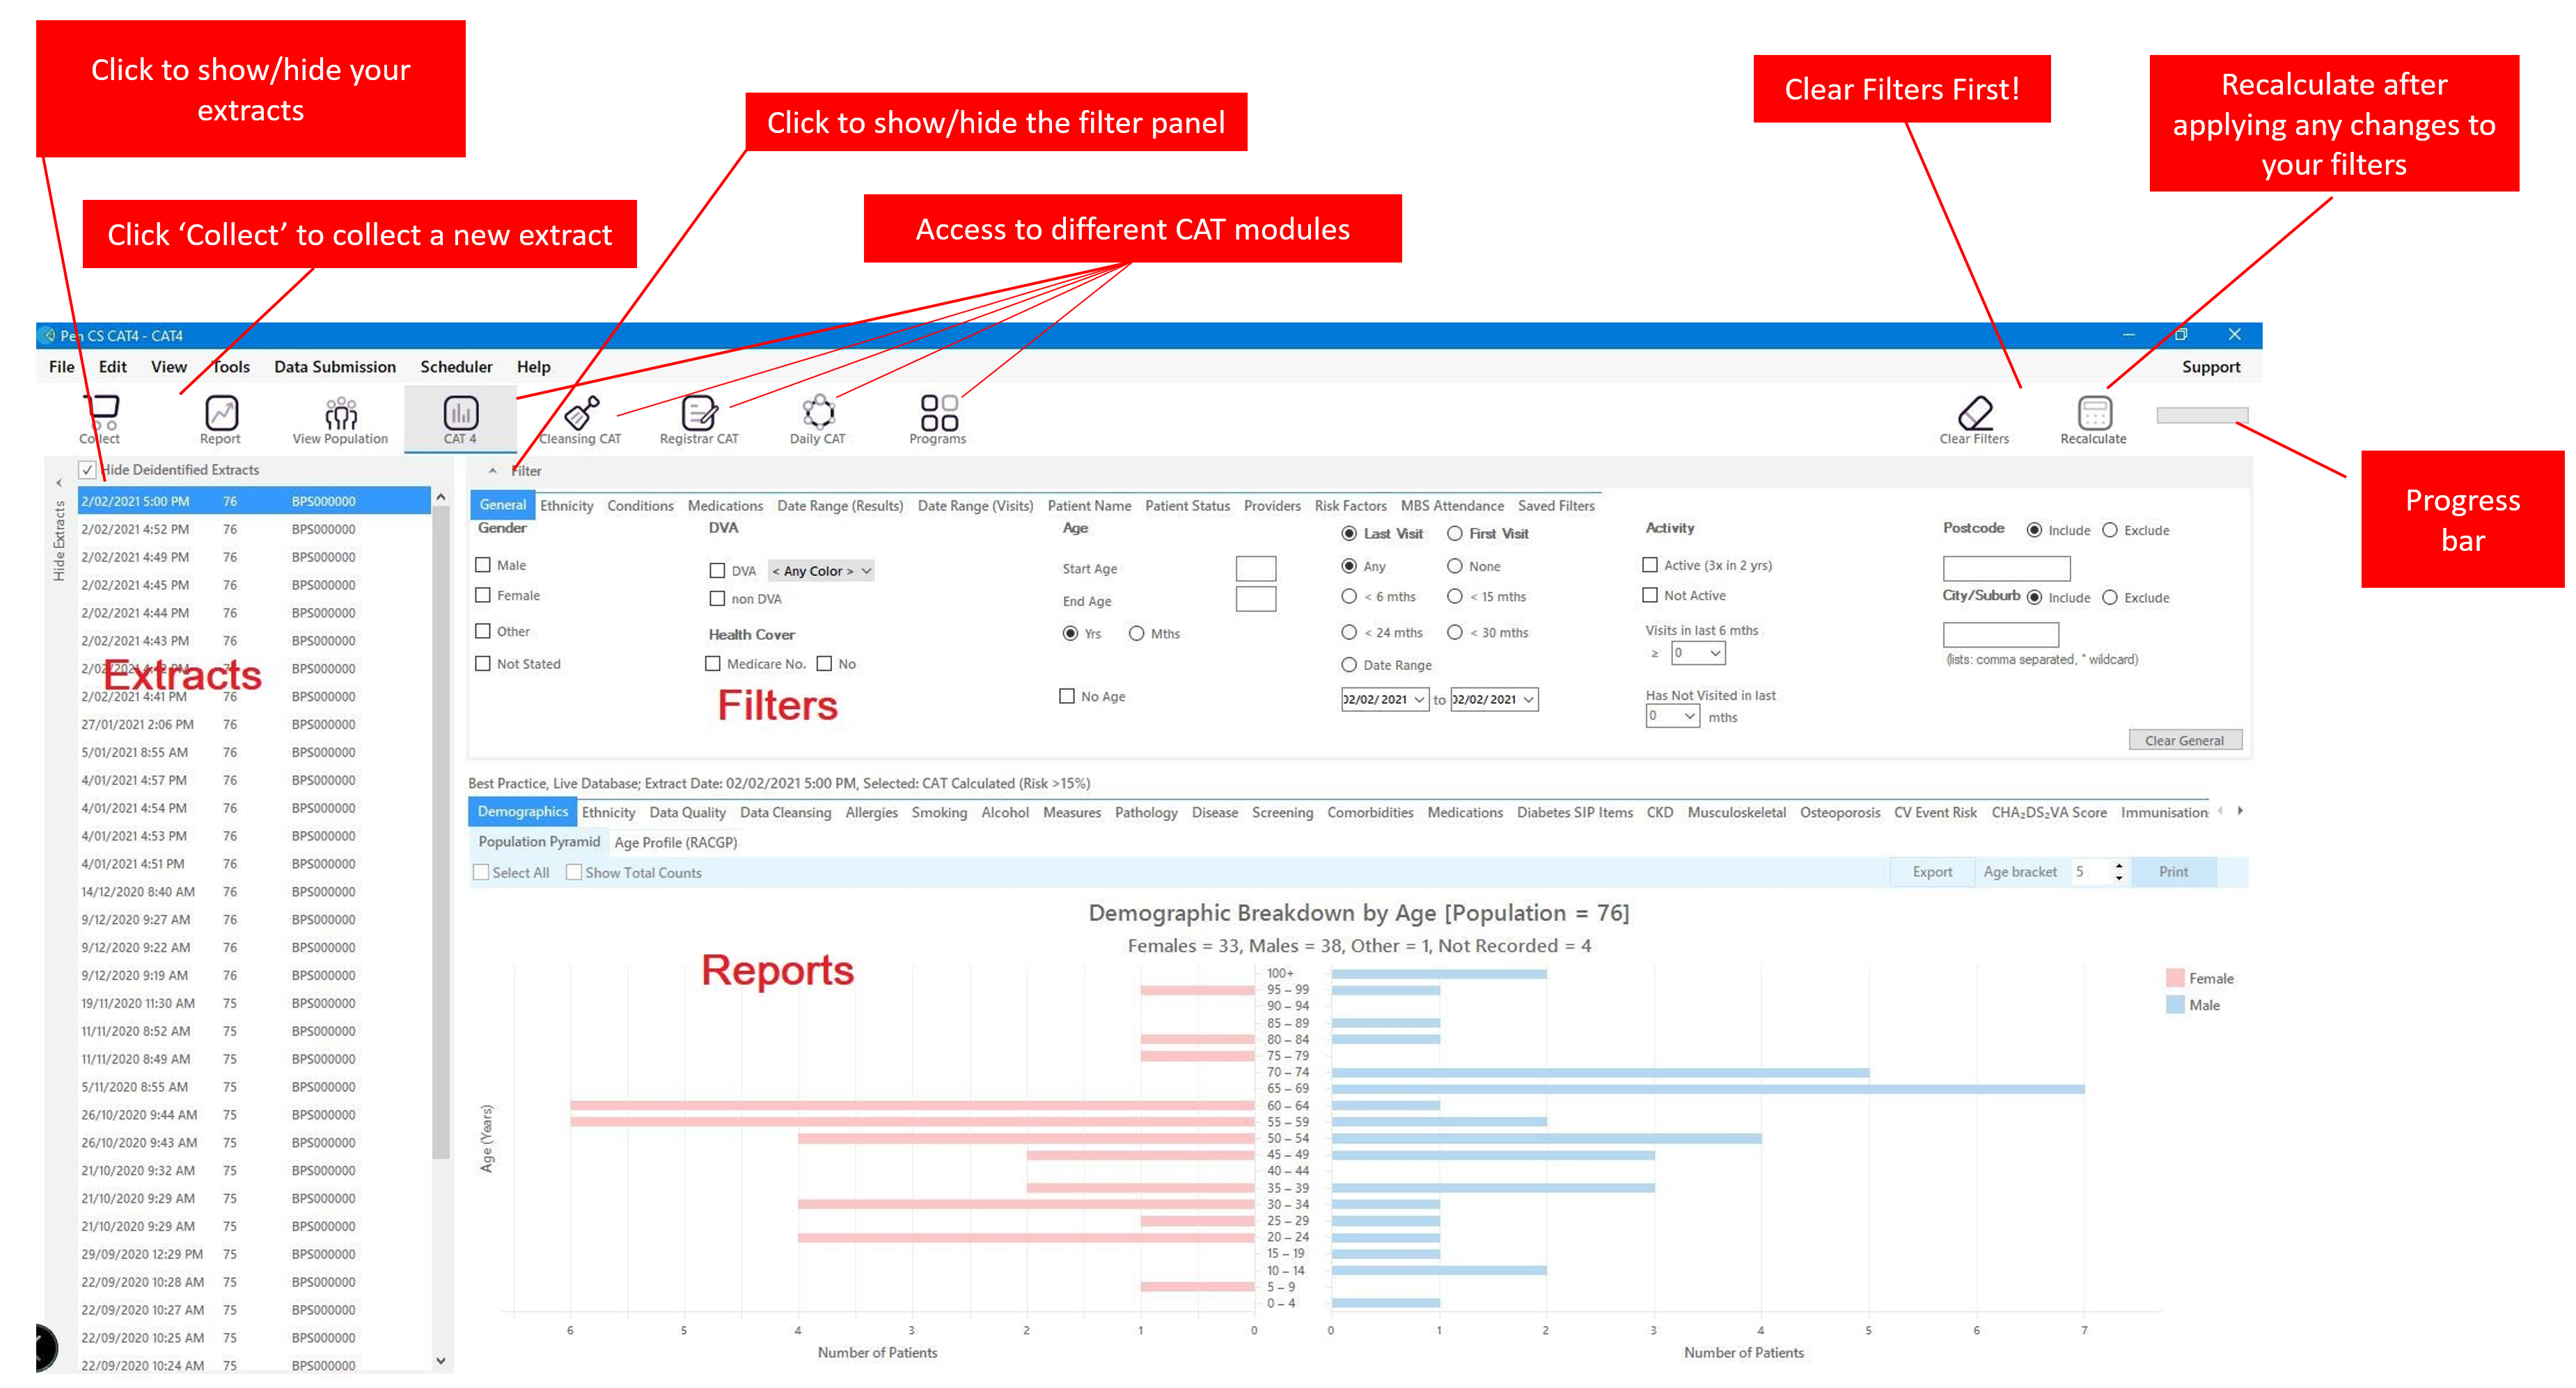
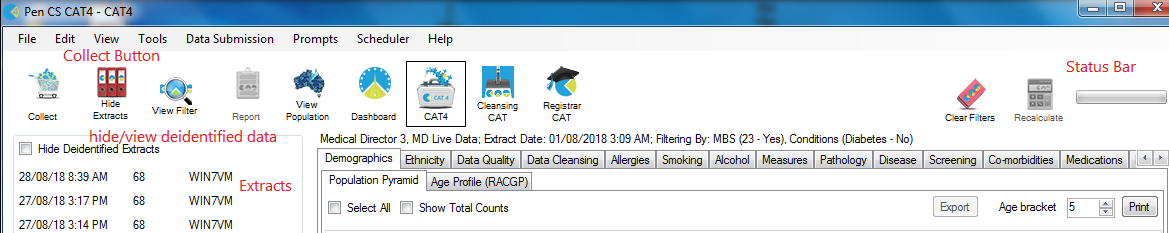
If you don't have any data extracts you will need to run a new collect. Check the extract pane for extracts before you run a collect. The CAT4 user interface is explained below.
Navigating CAT4 Menus
The CAT4 screen has been broken into four key areas, Menu Bar, Data Extracts, Filters and Reports.
Navigating Cleansing CAT4 Menus
Navigating Reports
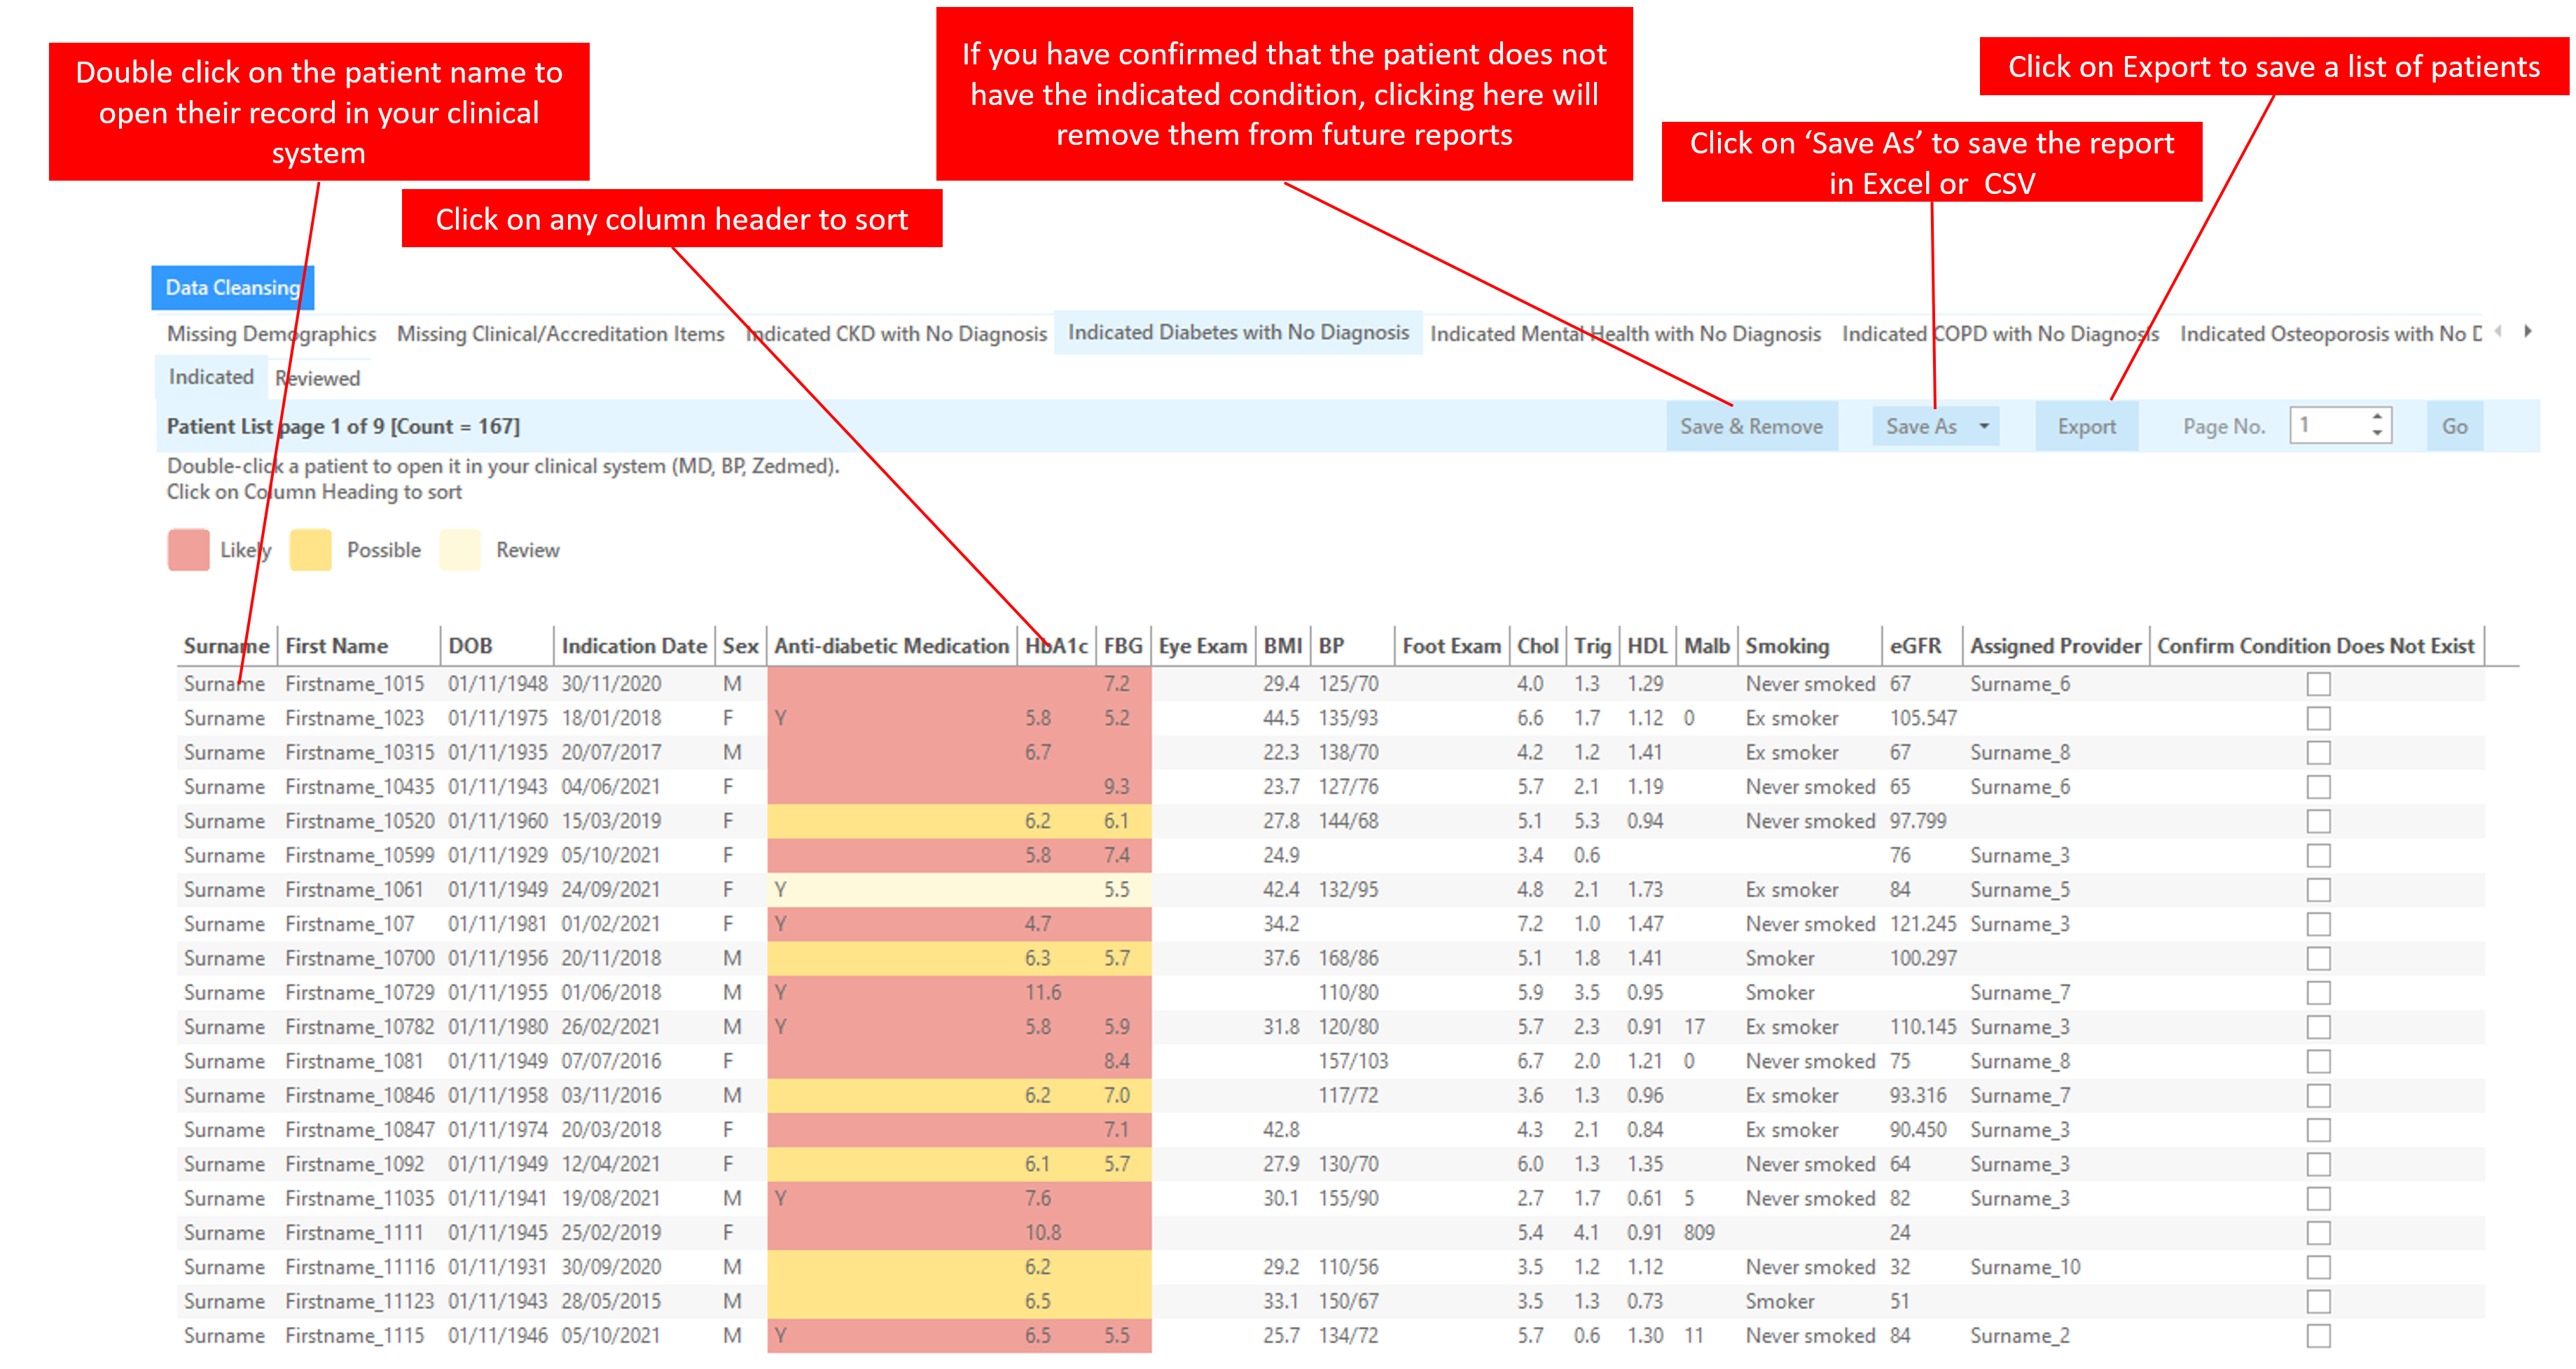
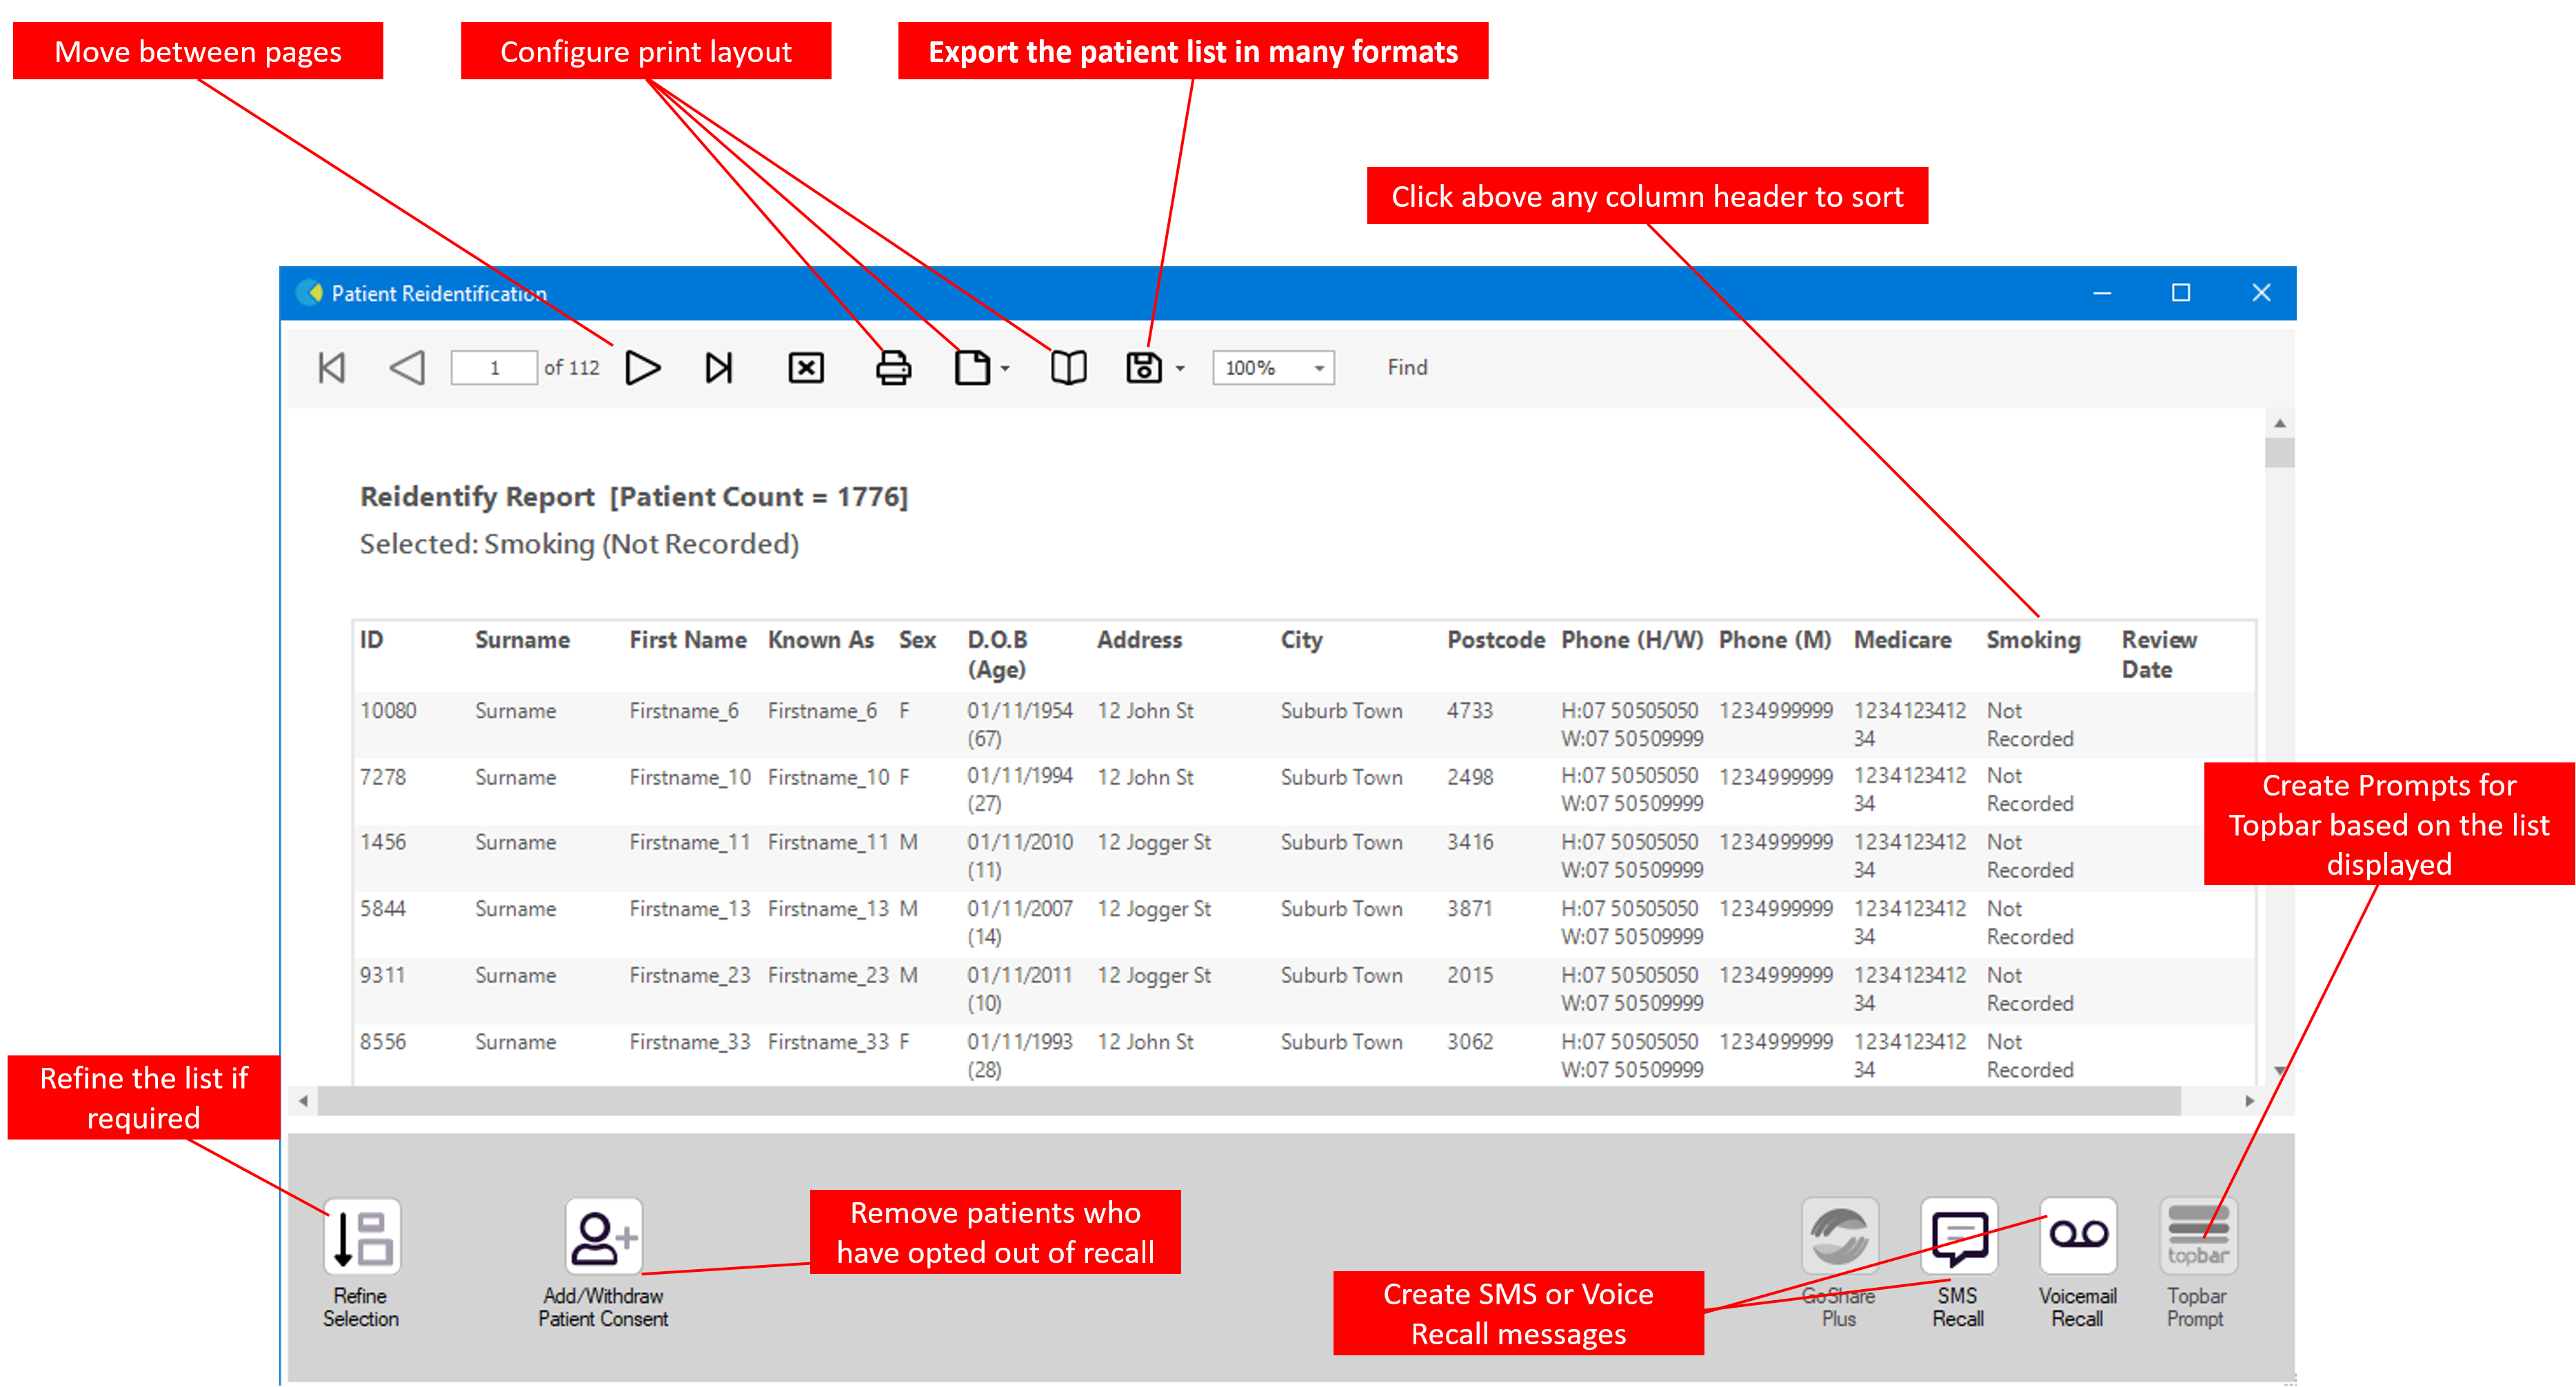
A patient reidentification report produced in CAT4 and Cleansing CAT will display to your screen. You can save your report in Excel, Word or PDF formats or print a hard copy.
It is recommended to hide the data extracts (Snapshots) and data filter (Filters) areas of the screen in order to make best use of your screen space to view the data results (Reports). You can toggle between the View/Hide modes at any time by clicking on the arrow icon in the respective bar.
Note: On first start-up, the report tabs will be empty as you have not yet collected data from your clinical desktop system or loaded an existing extract file.
If you have a newly installed CAT4, it is unlikely that you have any data collections, so you will have to run a new collect. Please don't run a collect during busy hours, as it will add load to your server and may slow down your system. To run a new collect, follow the steps below.
NOTE: Before you start collecting data ensure you have set up your preferences to point to the correct clinical desktop system for your practice
See Setting Your Preferences for details about how to do this.
Once you click the 'Collect' button you will see the 'status bar' in the top right hand corner of the screen flashing while the data is retrieved from the clinical desktop system.
- Genie, practiX, Medinet, Medtech and MMEx users please note that the data collection is performed from within your clinical application. Clicking the CAT4 'Collect' button at the top left of the screen will provide you with the summary steps on how this is done for your system. Step by step details are provided here: Choosing your Clinical Desktop System
- Zedmed users please note that to enable CAT4 to extract this data it needs to access the Blobs folder. This folder is used by Zedmed to store HL7 based data. The default location is c:\zedmeddata\blobs but this can vary depending on your installation – to verify the location you can check CRS_App_Server.ini (which may be in a folder called ZedmedServer) which should have an entry called BLOBFilesPath=C:\ZedmedData\Blobs{color}
The data set collected is saved in your preferred data folder (see 'Setting Your Preferences' for more information).
When the data retrieval has completed you will see an entry in the left hand column. The data is stored as a 'snap-shot' on your PC. You can use this 'snap-shot' for analysis at any time in the future.
Tip: To refresh the list of 'snap-shots' toggle the 'hide/view Extracts' button.
Each entry displays the date/time of collection, the number of records retrieved and the machine name on which the collection was done.
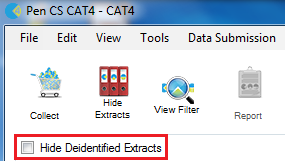
The tick box on top of the panel allows you to hide deidentified extracts to only show extracts containing your patient details.
Tip: To refresh the list of 'snapshots' toggle the Hide/View Extracts button.
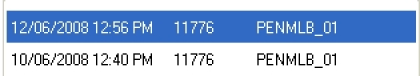
Each data set entry displays the date/time of collection, the number of records retrieved, and the machine name on which the collection was performed.
There is no limit to the number of data sets you can collect. Each data set will be listed as an entry in the left hand panel.
To analyse a specific data set, click on the entry for that data set. It will become highlighted and you will see the 'status bar' in the top right hand corner of the screen flashing while the data is reloaded from the 'snapshot' into CAT4.
Once the data collection is complete, you can view your PIP QI report, full information on the report can be found here: PIP QI Improvement Measures.
To create the JSON file for export, follow the steps below.
To access this export functionality, load your data, then go to Standard Reports/Indicator Sets/PIP QI Report and click on the 'Export' button.
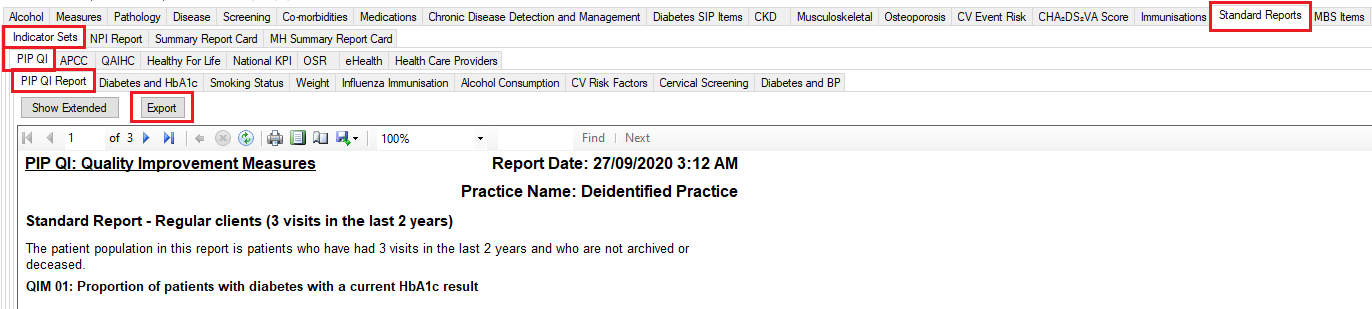
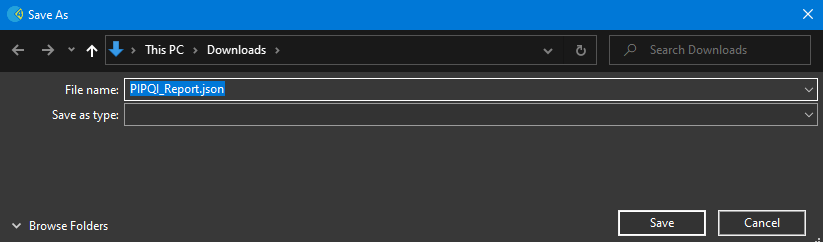
This will prompt you on where to save the file. Choose a location on your computer or network that you remember and click on 'Save'.
Once you have saved the file you can upload it to your PHN.
Once you have created the JSON file, you need to upload it to your PHN. The steps to upload the file are show below.
Once you have loaded the portal, please enter your username and password - this will be provided by the PHN or Pen CS support.
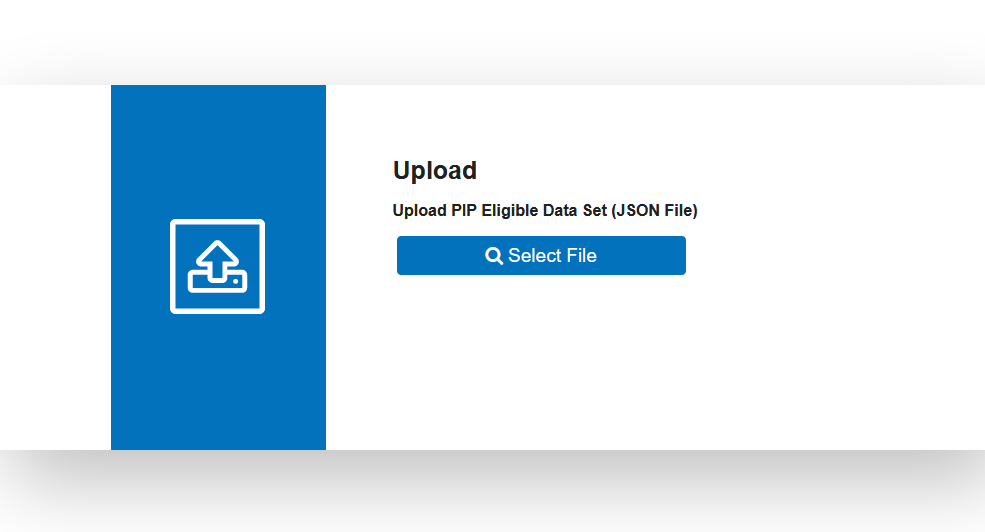
After successful log-on you will see an option to upload the PIP QI JSON file, click on 'Select File' to open your Windows Explorer and navigate to the JSON file.
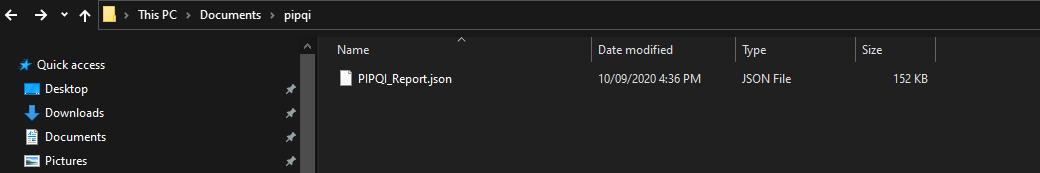
Remember where you saved the file when you created it and open that location, click on the file and then on 'Open'
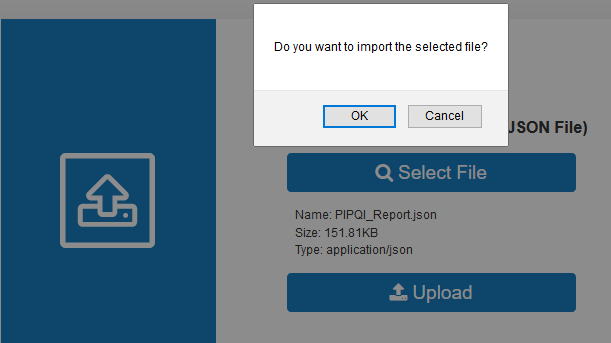
Click on 'OK' to import the file.
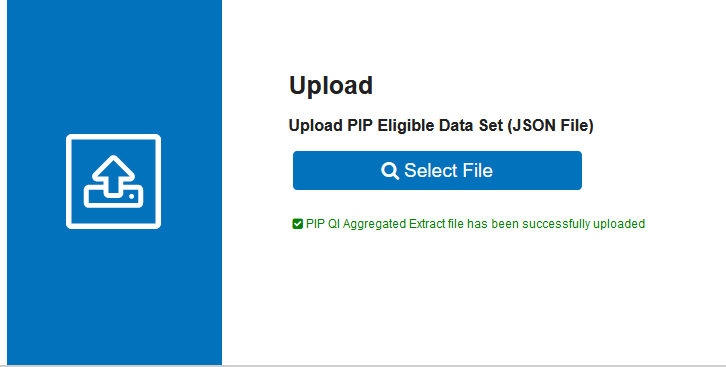
As the JSON file is small, the upload will not take long. Once it is completed, you will see the following screen:
If you experience any errors when uploading, make sure you have selected the correct file. If you have verified that the correct file was used, please contact the Pen CS support team for further assistance.