· Children under the age of two will be excluded
· The Child cut-off values for the categories listed below will reflect the Australian Bureau of Statistics recommendations
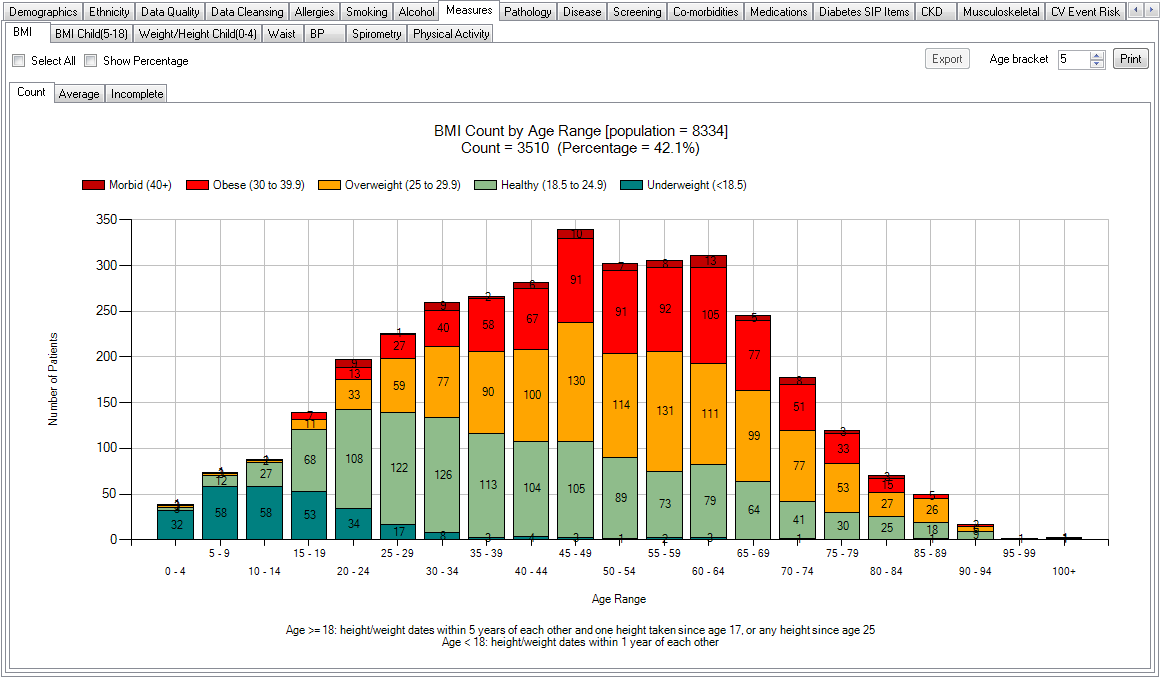
Measures > BMI displays your data as a breakdown of BMI status (currently valid for patients >18 yrs) :
- Morbid Obesity (40+)
- Obese(30 to 40)
- Overweight(25 to 29.9)
- Healthy(18.5 to 24.9)
- Underweight(<18.5).
The data is displayed as
- Count per age range in a bar chart
- Average BMI per age range in a bar chart with the healthy range indicated
- Incomplete – where either of height, weight or height/weight are missing so BMI cannot be calculated
Functions available are as described for Demographics (Bar Chart).
The 'Count' on the Count graph will show you the total of the patients graphed – this is the total number of patients where BMI has been able to be calculated . The Percentage equivalent of Count is displayed in brackets.
BMI Mappings with clinical systems
The BMI mappings are provided in the 'General Data Mappings' Appendices under Measurements for each clinical system.
BMI, where calculated from height and weight, will use the weight date as the measurement dates and requires that height has been recorded in the following timeframes:
Age >= 18:
- Height/weight dates are within 5 years of each other AND
- At least one height recorded since age 17 (for age 18-24)
- At least one height recorded since age 25 (for 25+)
OR
Age < 18:
- Height/weight dates are within 1 year of each other